Monitor
Overview
- The Monitor page includes two tabs:
Data Quality Performance
Data Quality Errors
Data Quality Performance
Qualdo has different metrics to track the quality of the data.
Metric Groups
Data Quality Performance Metrics are organized in terms of Metric Groups.
Default and Custom Metrics are always members of one Metric Group.
Metrics analyze data and generate a value, based on the data analyzed and the Metric definition.
The default list on the Data Quality Performance tab is a random collection of 1 - 3 Metrics. If there are more metrics/datasets/attributes present, these can be viewed by clicking Show More.
Note that while Default Metrics are organized in fixed Metric Groups, a Custom Metric is placed in an existing Metric Group by the user.
Chart View Organization
- DATA DRIFT
Dataset, Attributes & Custom Metrics
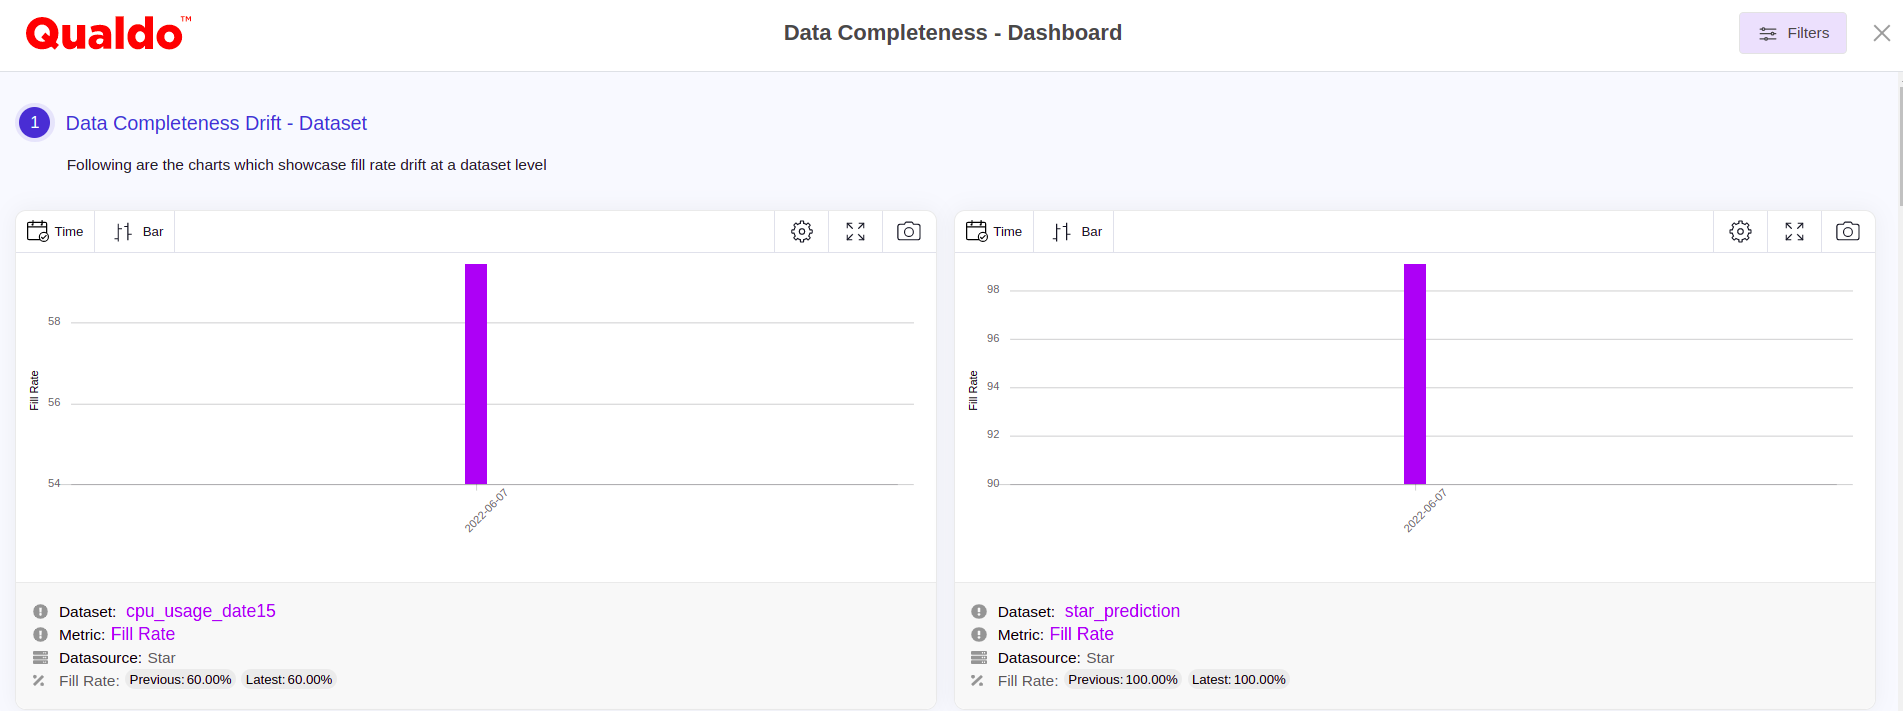
- DATA COMPLETENESS
Data Completeness has three sections to track the drifts in the different completeness metrics:
- Tracked by Dataset
Fill Rate
Row Count
- Tracked by Attribute
Fill Rate
Custom Metrics
- DATA UNIQUENESS
Dataset, Attributes & Custom Metrics
- DATA TIMELINESS
Dataset & Custom Metrics
- DATA ACCURACY
Dataset, Attributes & Custom Metrics
- DATA CONFORMITY
Data Conformity has eighteen sections to track the drifts in the different Conformity metrics:
- Tracked by Dataset
- Data Conformity
Credit Card
Date
Gender
Http
IP
SSN
URL
Boolean
- Tracked by Attributes
- Data Conformity
Credit Card
Date
Gender
Http
IP
SSN
URL
Boolean
- Custom Metrics
Data Conformity
- DATA CONSISTENCY
Data Consistency has three sections to track the drifts in the different consistency:
- Tracked by Dataset
Data Type Consistency
Categorical Encode
Normalization Consistency
- Custom Metrics
Data Consistency
Visualization
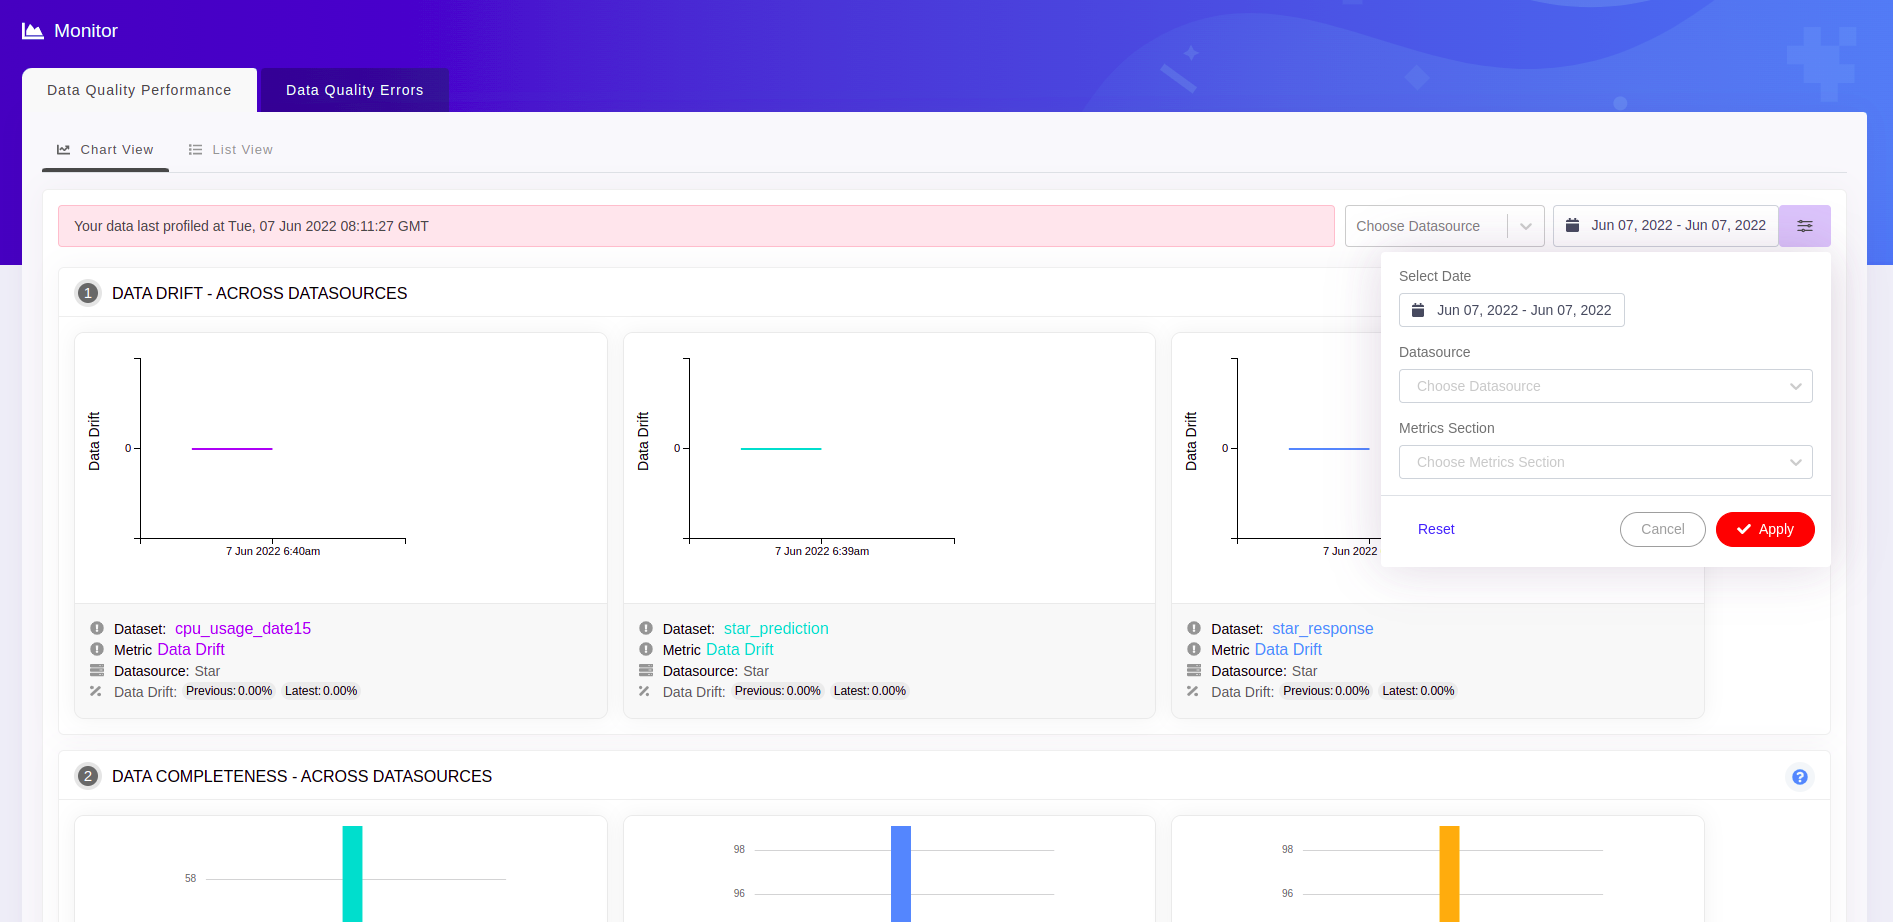
Chart View
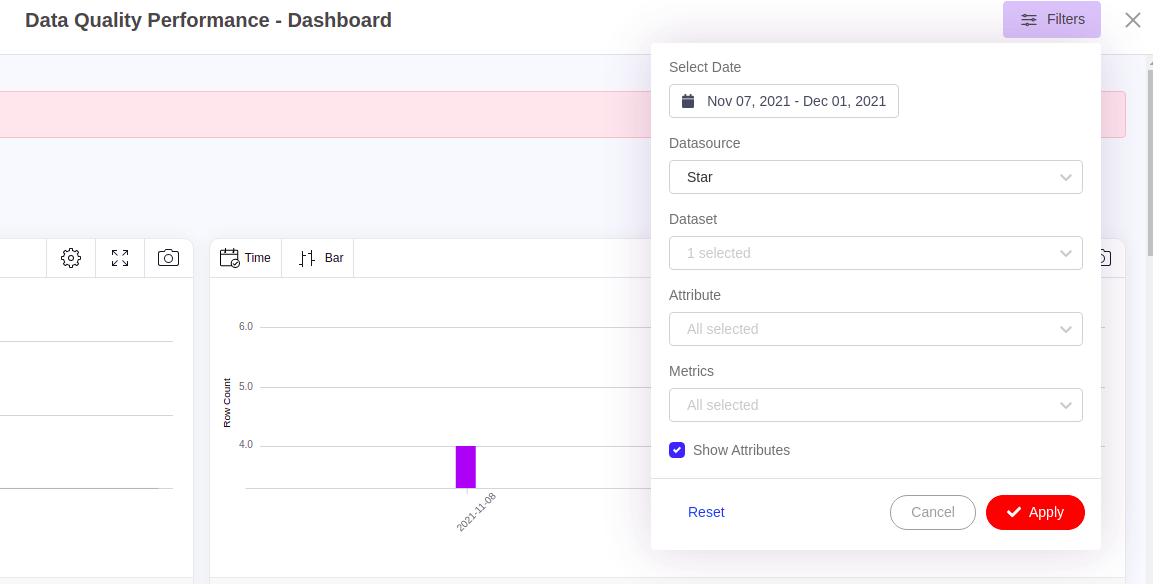
Datasets and attributes in the configured Datasources are monitored on the Data Quality Performance -> Chart View tab on the Monitor page. Up to three charts across all the configured Datasets will be displayed in each numbered section. The dashboard may be filtered based on Datasource and Metrics Section to view charts for the Datasets from a particular Datasource and metric section(s).
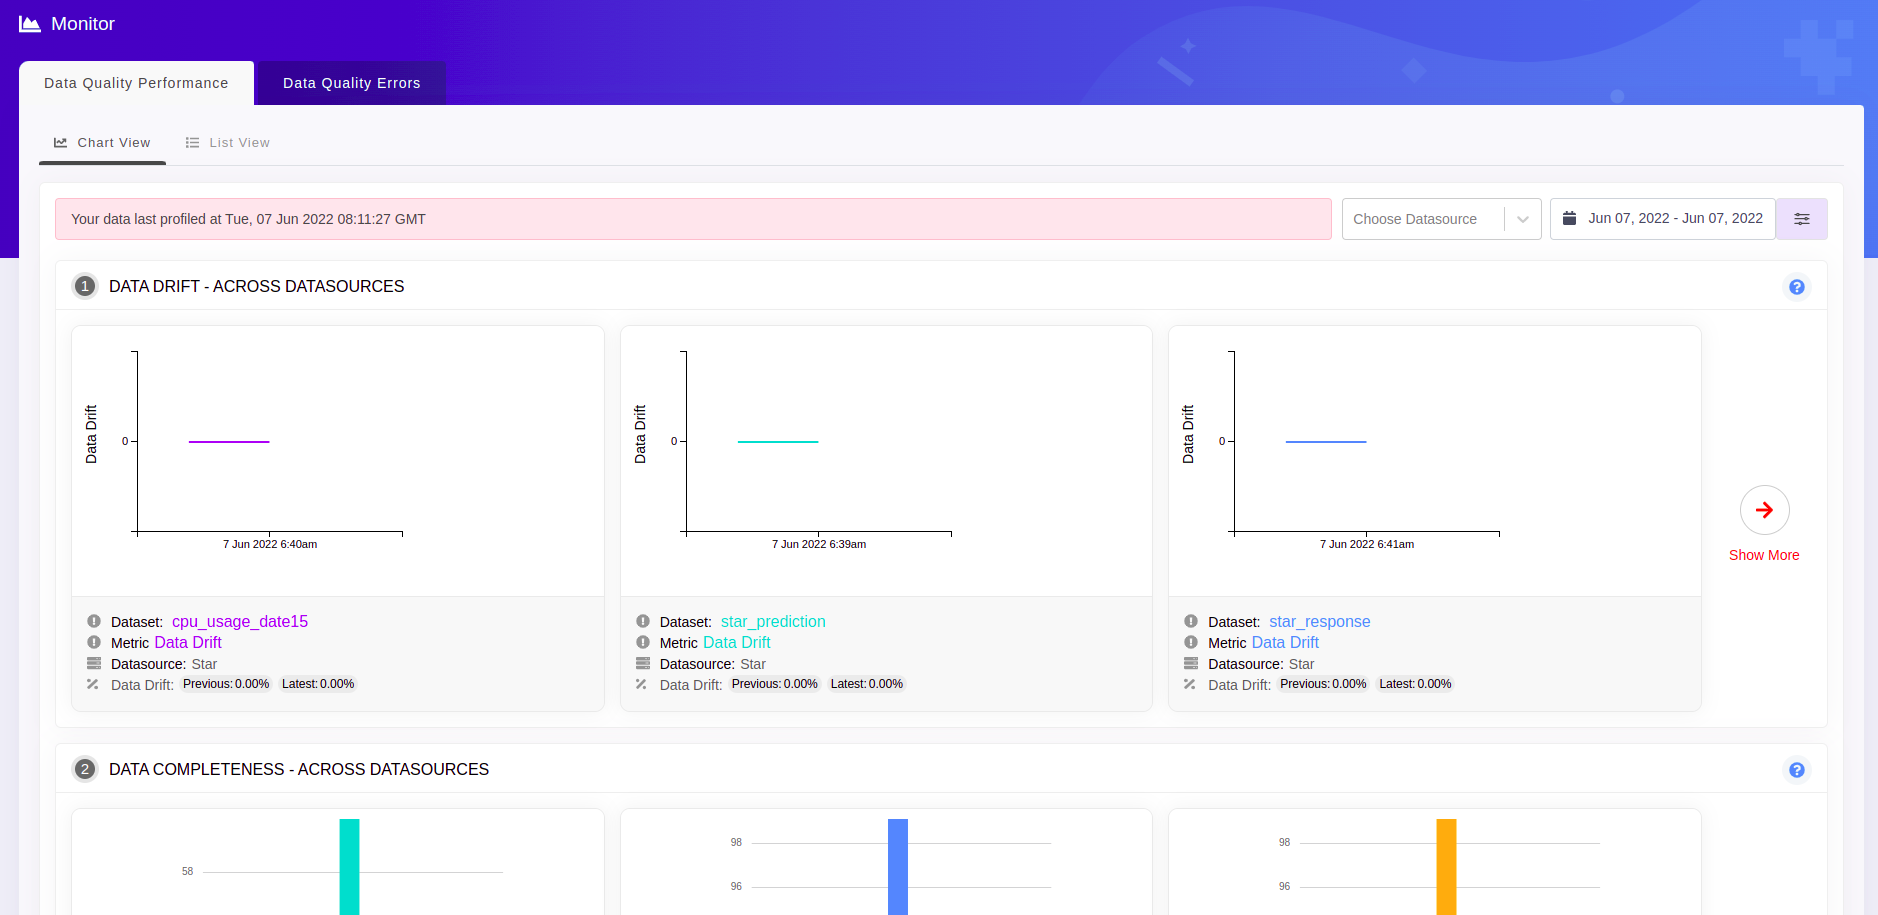
Each chart provides a summary of monitoring activity of a specific metric for a given Dataset.
Charts are grouped under Metric Groups.
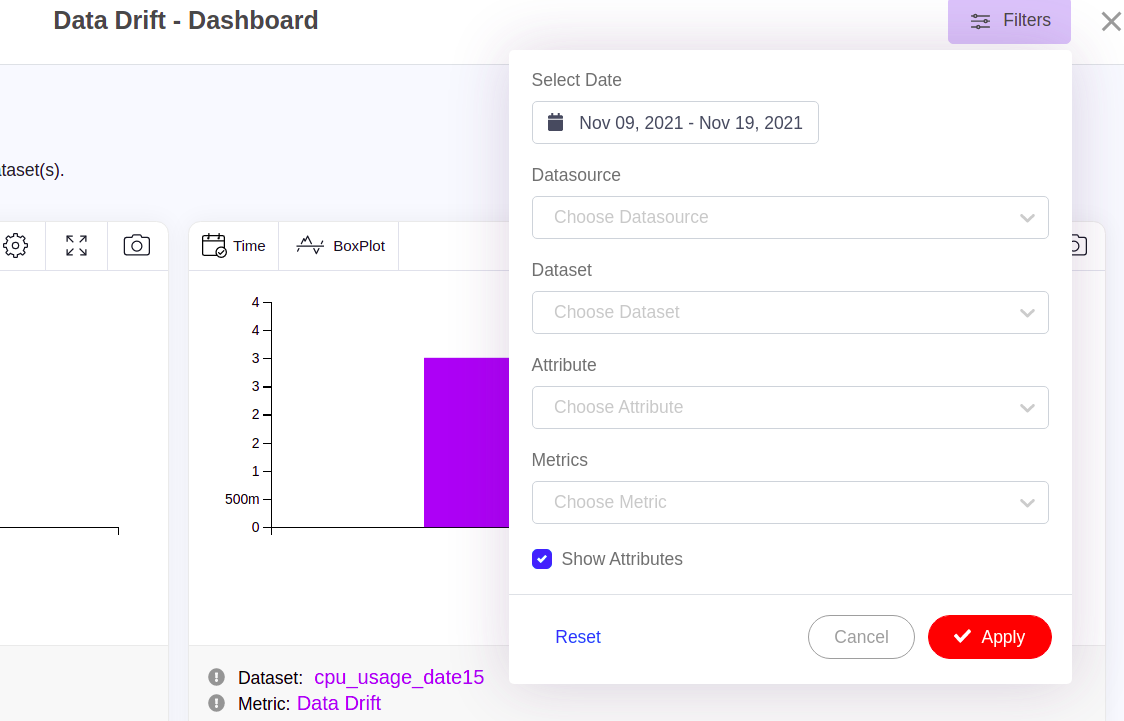
Click on Show More to view all the charts related to the Dataset(s) in the selected Datasource. In the detailed chart view a maximum of 30 data points are displayed, populated beginning from the date that has been selected.
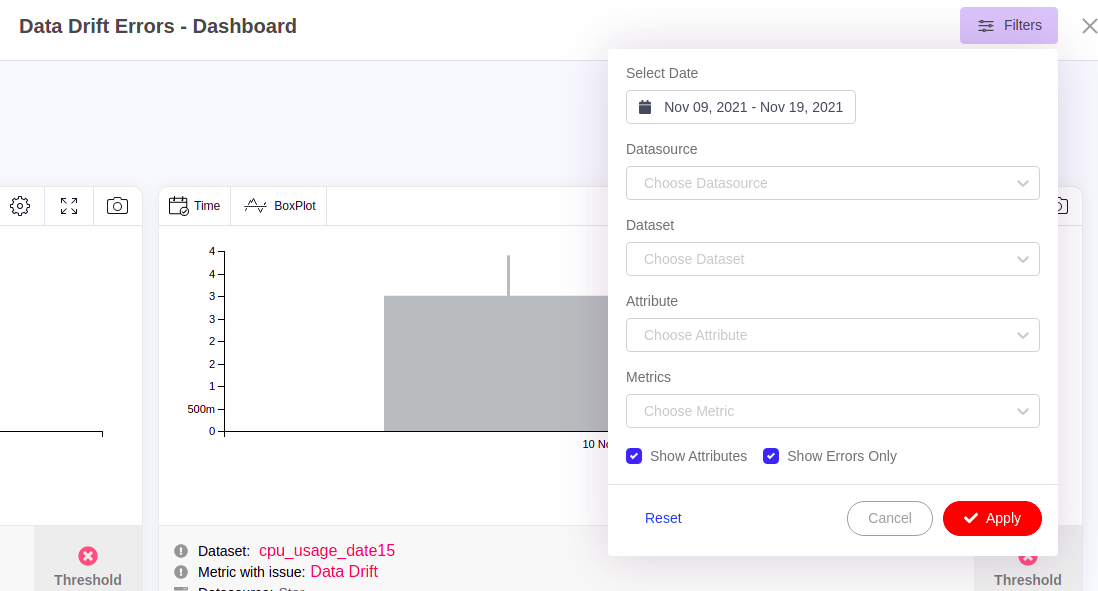
To focus on a specific Dataset/Attribute/Metrics apply appropriate filters available at the right top and select the options of interest.
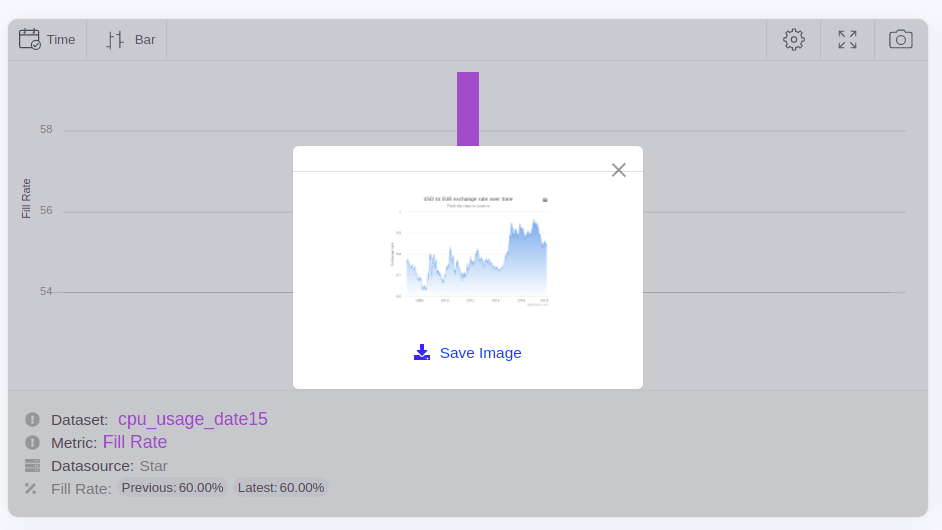
Each chart has relevant filtering options such as Chart Type, Compare, and Timeline to add insight regarding the changes in the metrics result over time. Qualdo also allows the user to save the chart as an image by clicking the Camera icon.
List View
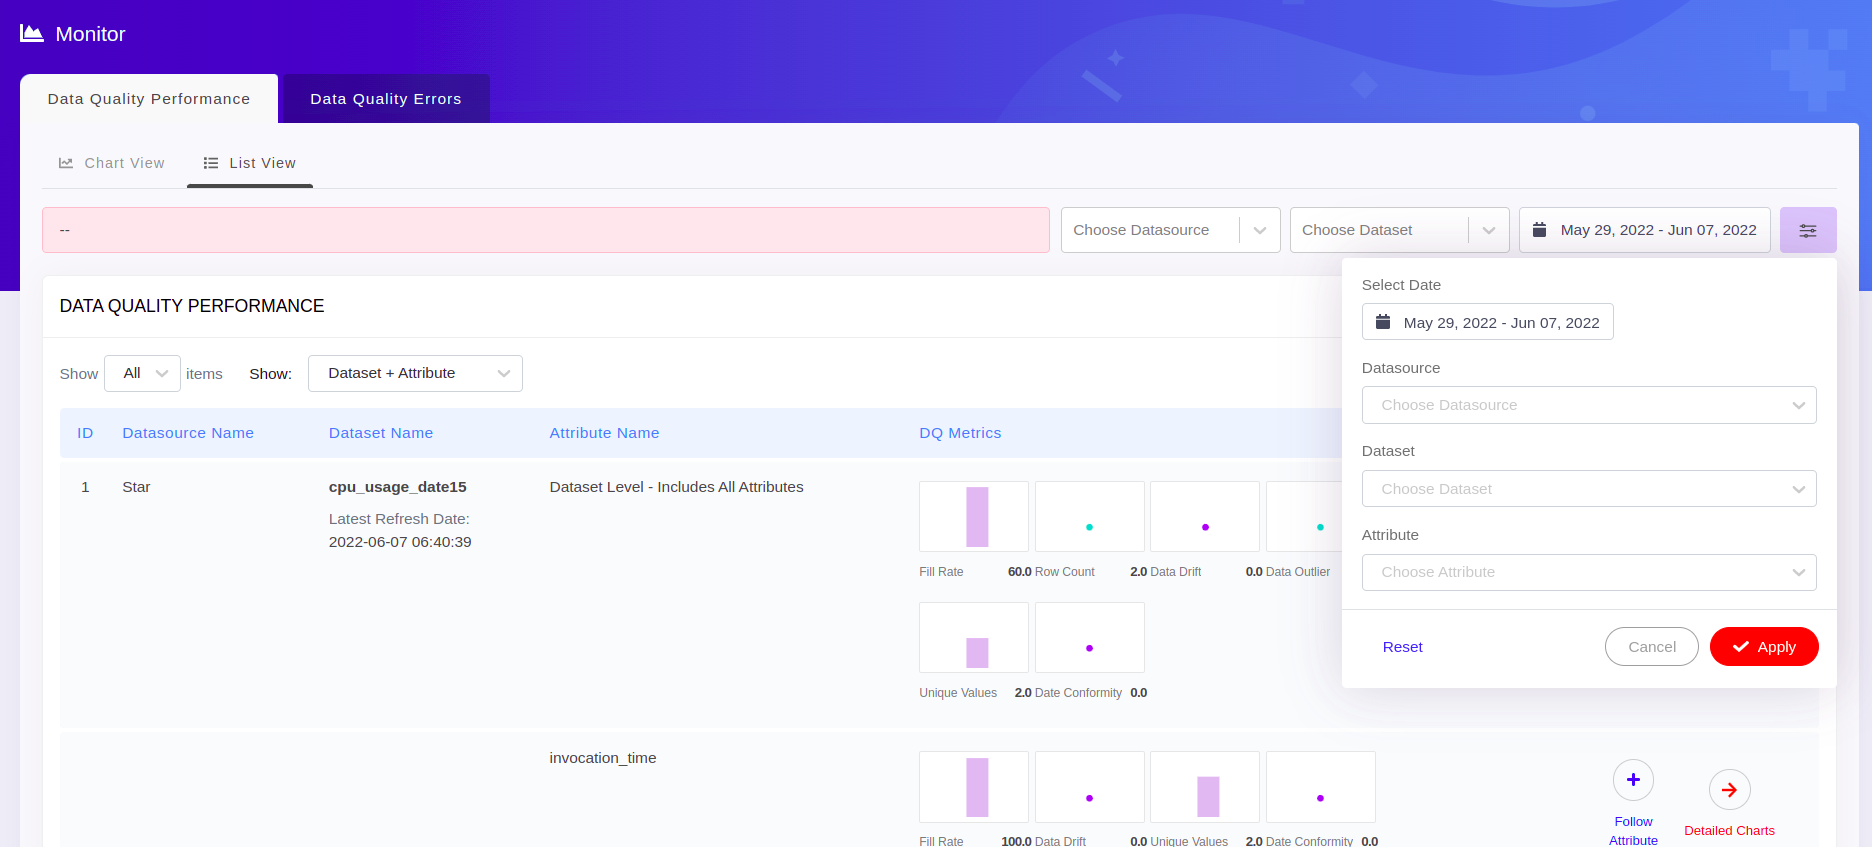
Datasets and attributes in the configured Datasources are monitored on the Data Quality Performance -> List View tab on the Monitor page. By default up to 50 items will be displayed on a page. All the Attributes and the Datasets in the configured Datasources will be listed. The table may be filtered by Date, Datasource, Dataset and Attributes to view a filtered summary for the Dataset(s) and Attributes.
By adding or removing attributes to/from the Following Attribute list, one may monitor the metrics for the set of attributes of their interest.
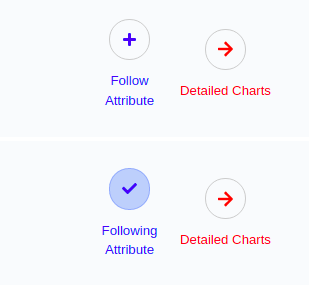
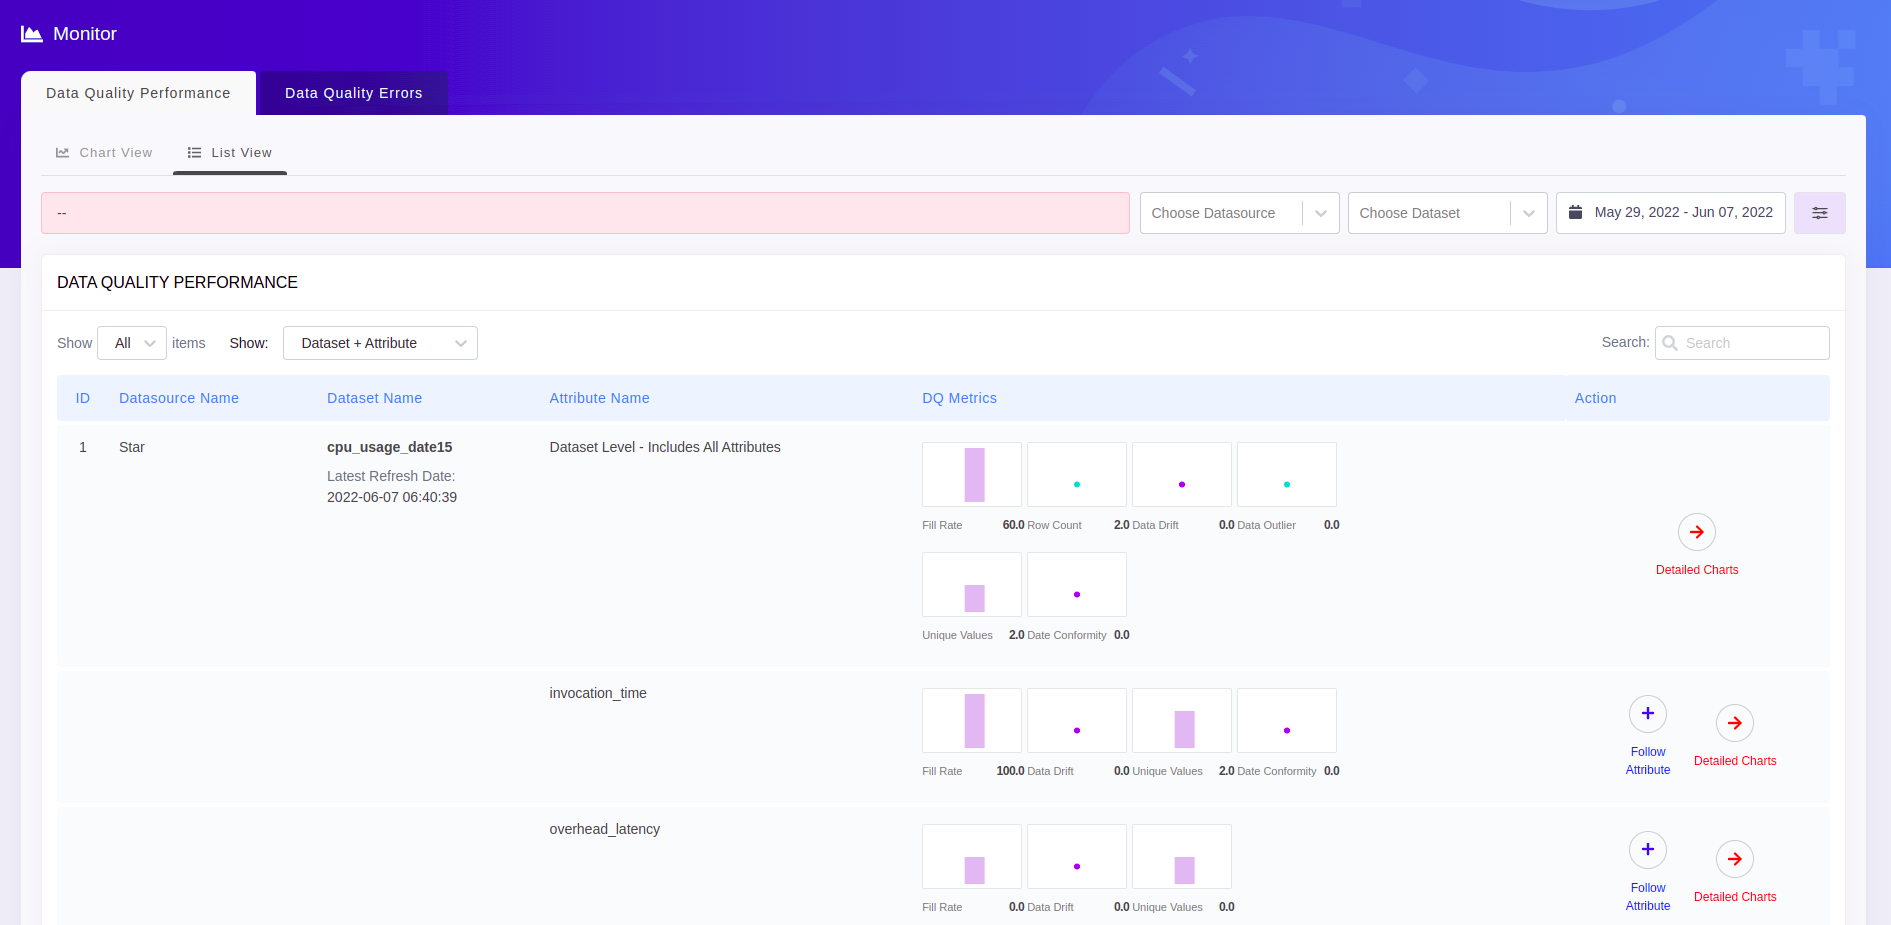
By using the Show filter on the Data Quality Performance table, one may also list the metrics for Dataset+Attributes/Dataset Only/Attributes Only/Followed Attributes Only
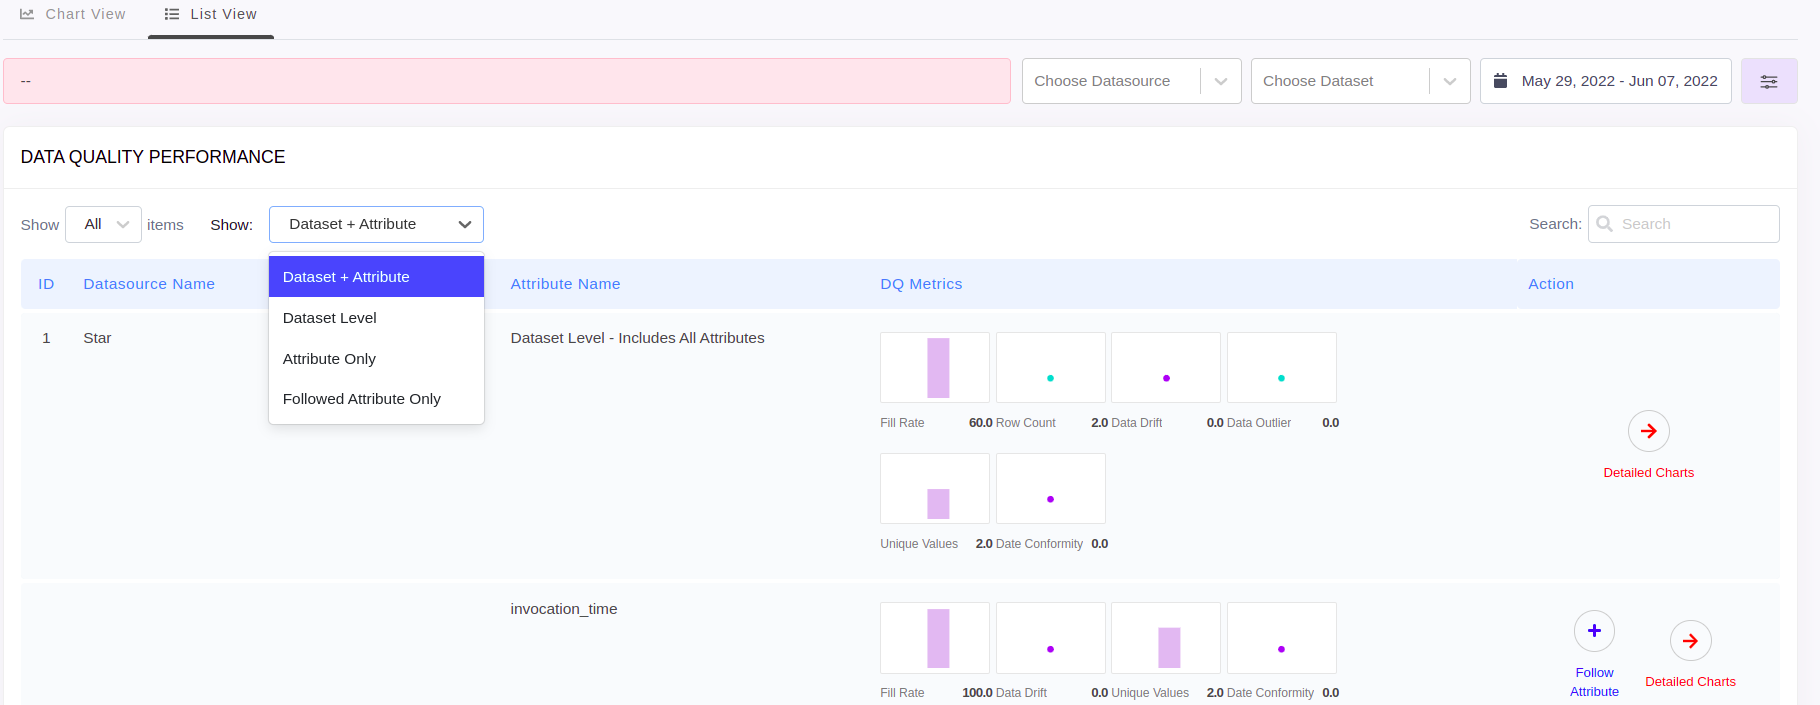
The Table is organised to display a Dataset summary. Data quality at the Dataset level are in the first row, followed by their attributes in the subsequent rows. Each row displays the thumbnail view of the chart(s) at the Dataset or Attribute level.
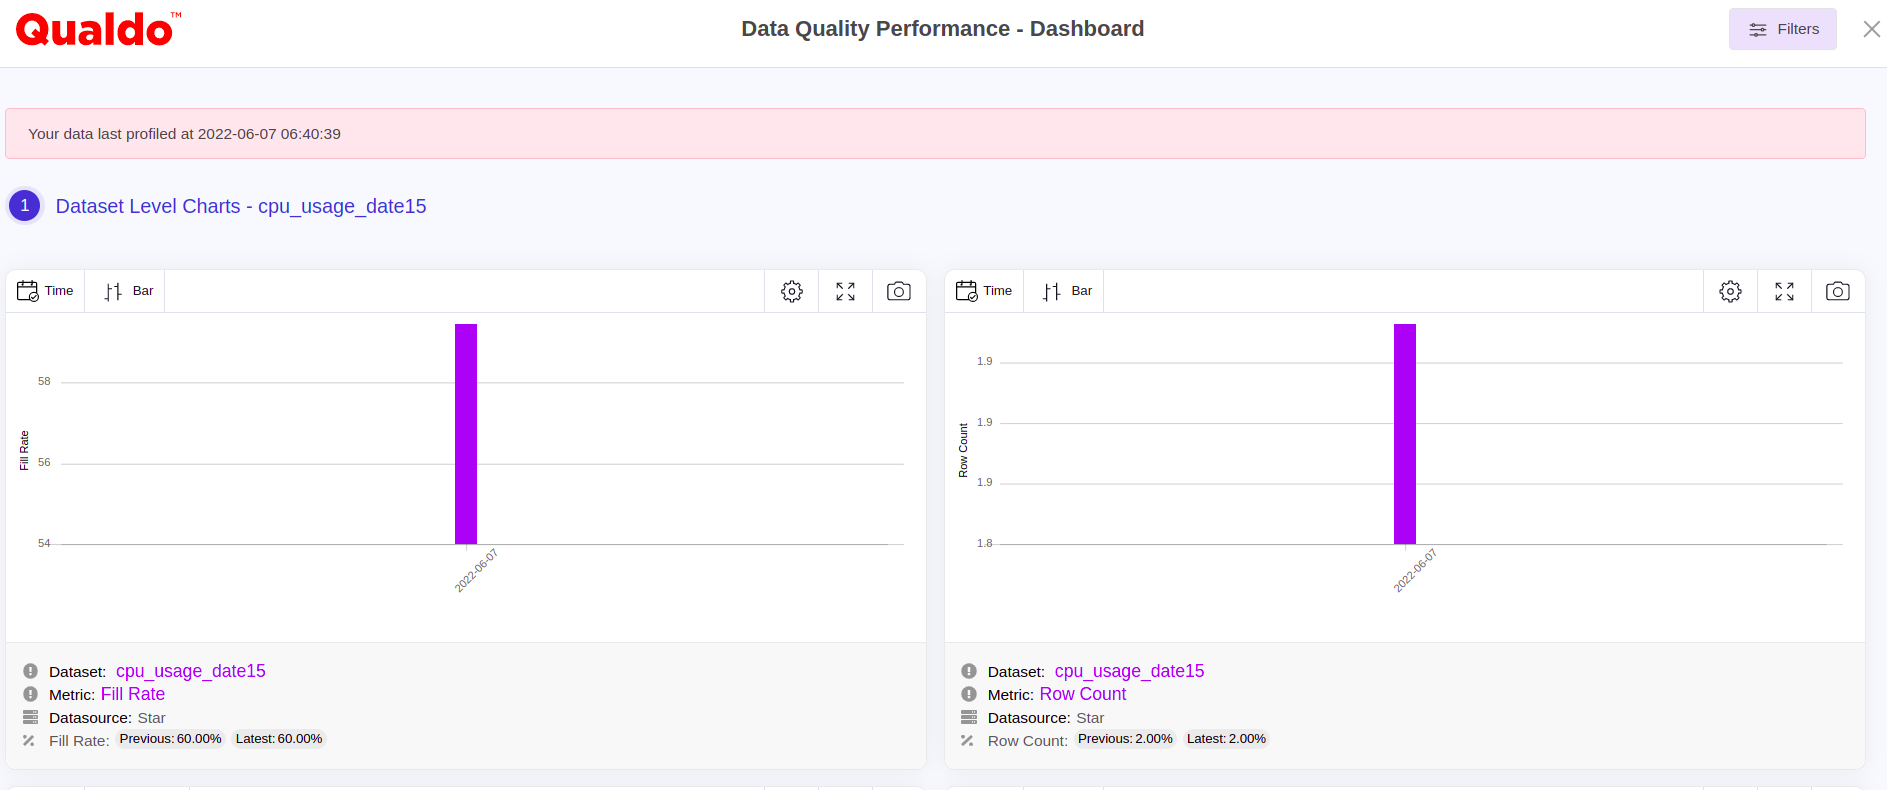
A maximum of seven datapoints are displayed in the thumbnail charts, within the time range that has been selected if present or from the last available dates. Click on Detailed Charts icon to view all the charts in detail. In the detailed chart view a maximum of 30 data points are displayed for the selected the time range.
On clicking Detailed Charts icon at the Dataset level row, displays all the detailed charts at Dataset level as well as each section at attribute level to display the attribute charts.
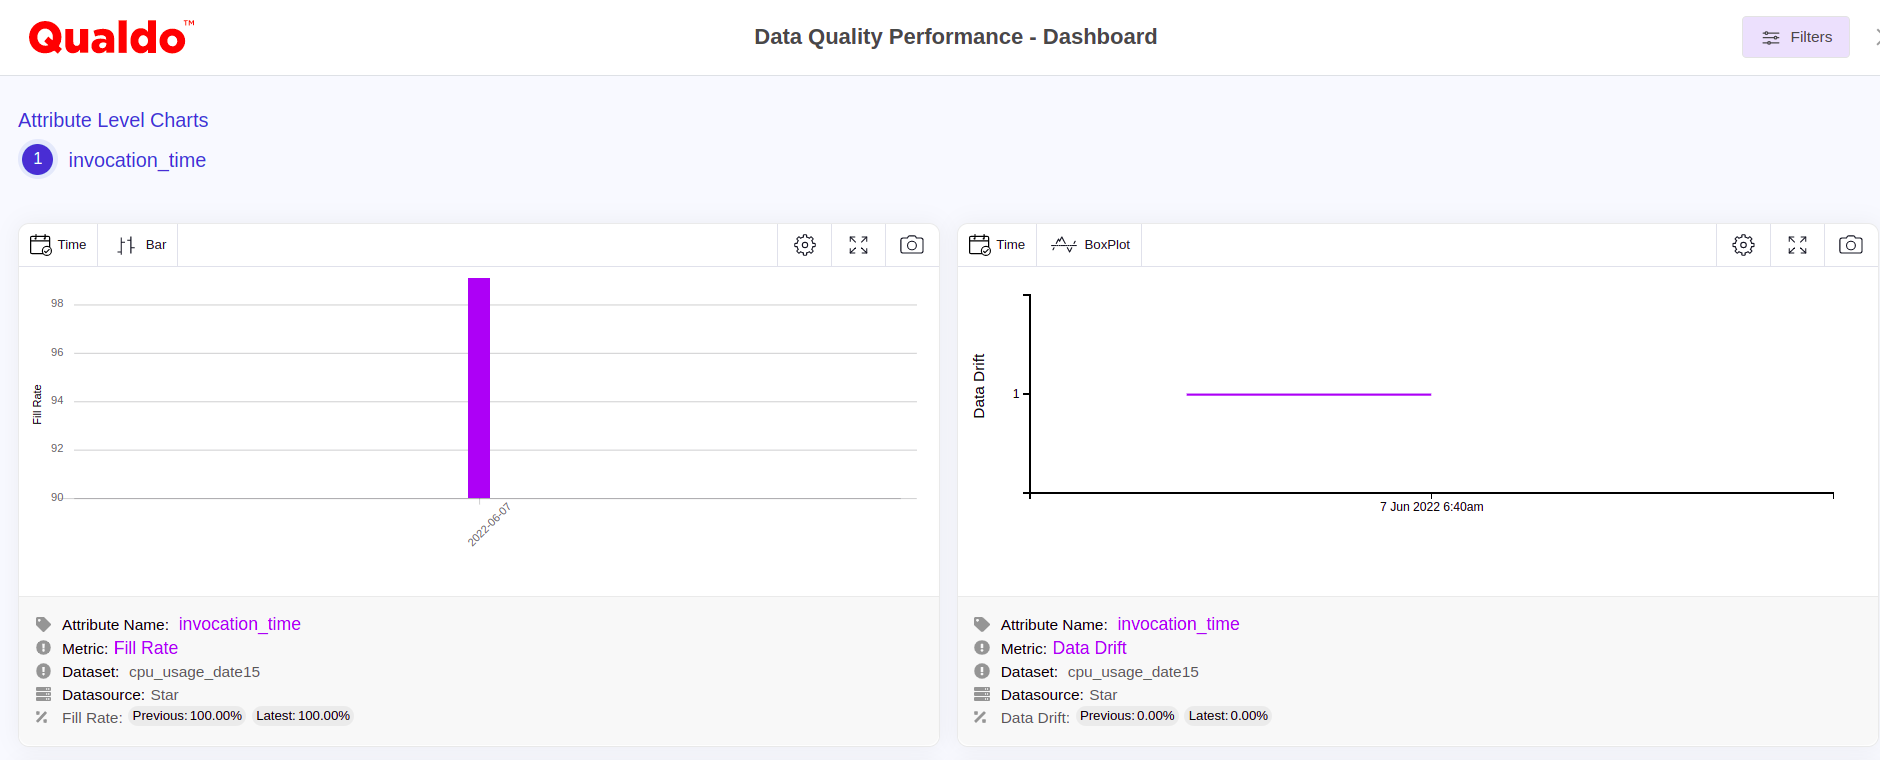
On clicking the Detailed Charts icon at the attribute level, detailed charts for that particular attribute will be displayed.
To focus on a specific Dataset/Attribute/Metrics apply appropriate filters available at the right top and select the options of interest.
Data Quality Errors
Qualdo employs the term ERROR to describe violations of a threshold value, percentage, or condition in a metric.
Metric Groups
Data Quality Errors are organized in terms of Metric Groups.
Default and Custom Metrics are always members of one Metric Group.
Metrics analyze data and generate either pass or fail, based on the data analyzed and the Metric definition.
The default list on the Data Quality Errors tab is a collection of 1 - 3 Metrics with identified errors. If there are more errors, these can be viewed by clicking Show More.
Note that while Default Metrics are organized in fixed Metric Groups, a Custom Metric is placed in an existing Metric Group by the user.
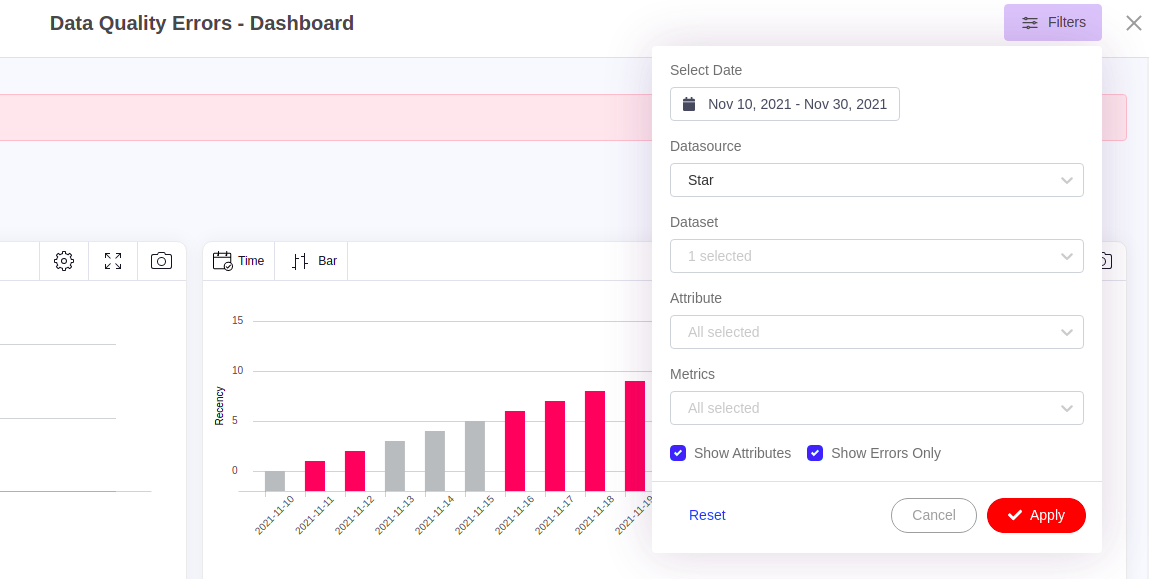
By using the filters on the Data Quality Errors Show More Dashboard, one may also list all the Metrics, whether pass or fail.
Chart View Organization
- DATA DRIFT ERRORS
Dataset, Attributes & Custom Metrics
- DATA COMPLETENESS
- Data Completeness has three sections to track the drifts in the different completeness errors:
- Tracked by Dataset
Fill Rate
Row Count
- Tracked by Attribute
Fill Rate
Custom Metrics
- DATA UNIQUENESS ERRORS
Dataset, Attributes & Custom Metrics
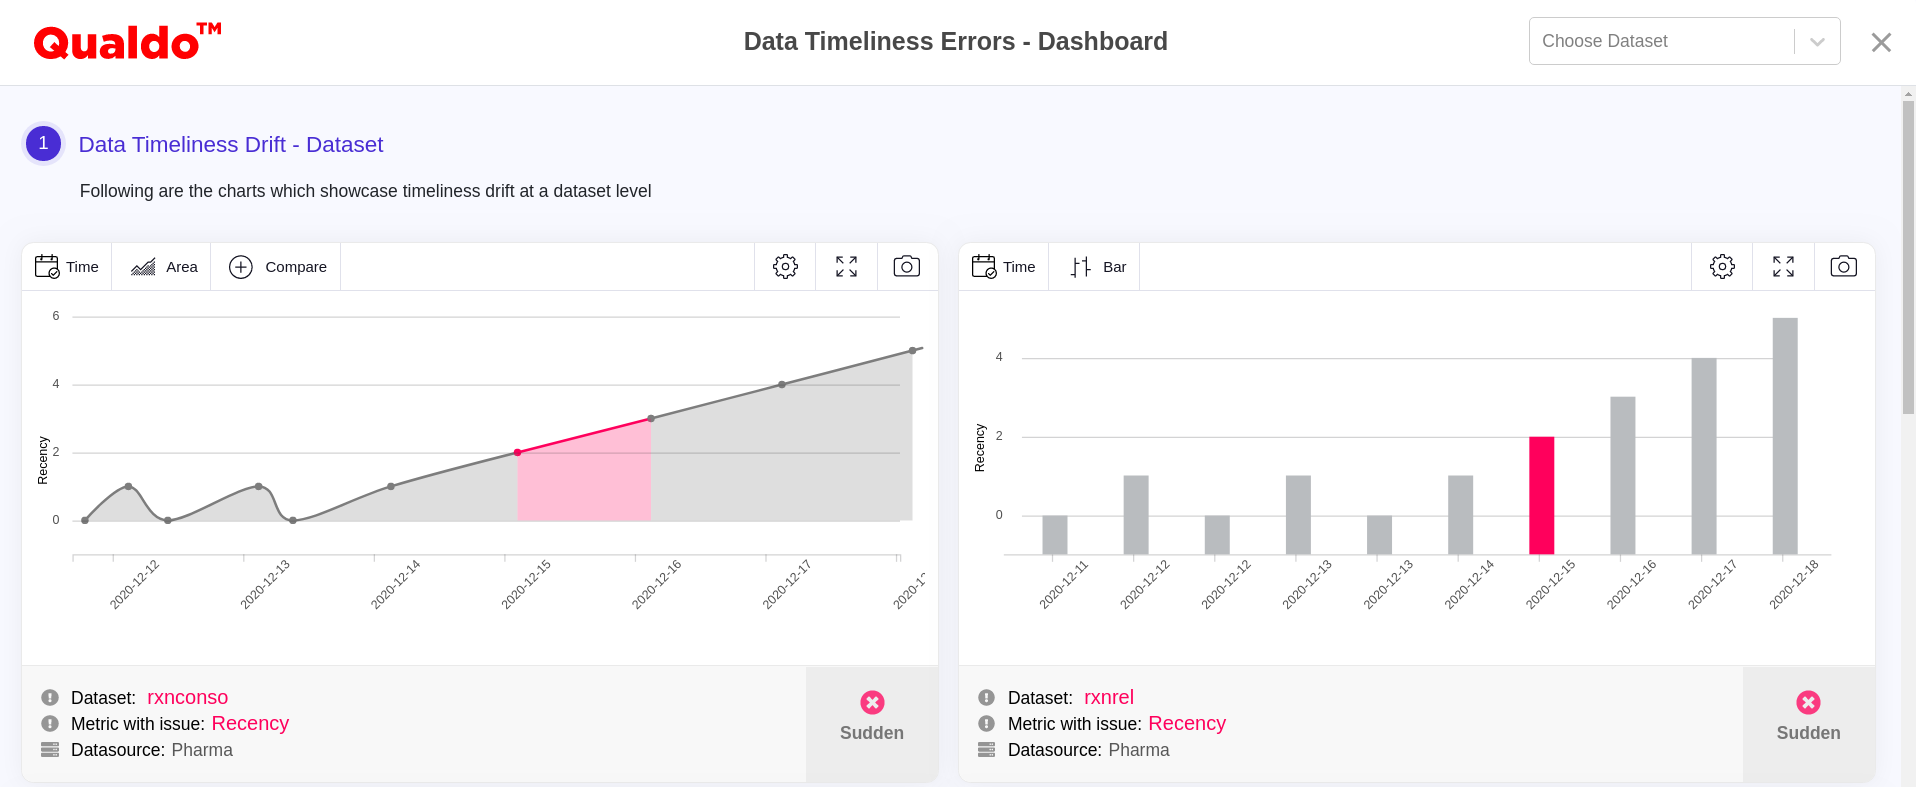
- DATA TIMELINESS ERRORS
Dataset & Custom Metrics
- DATA ACCURACY ERRORS
Dataset, Attributes & Custom Metrics
- DATA CONFORMITY ERRORS
- Data Conformity has eighteen sections to track the drifts in the different Conformity errors:
- Tracked by Dataset
- Data Conformity Errors
Credit Card
Date
Gender
Http
IP
SSN
URL
Boolean
- Tracked by Attributes
- Data Conformity Errors
Credit Card
Date
Gender
Http
IP
SSN
URL
Boolean
- Custom Metrics
Data Conformity Errors
- DATA CONSISTENCY ERRORS
- Data Consistency has three sections to track the drifts in the different consistency errors:
- Tracked by Dataset
Data Type Consistency Errors
Categorical Encode Errors
Normalization Consistency Errors
- Custom Metrics
Data Consistency Errors
Visualization
Chart View
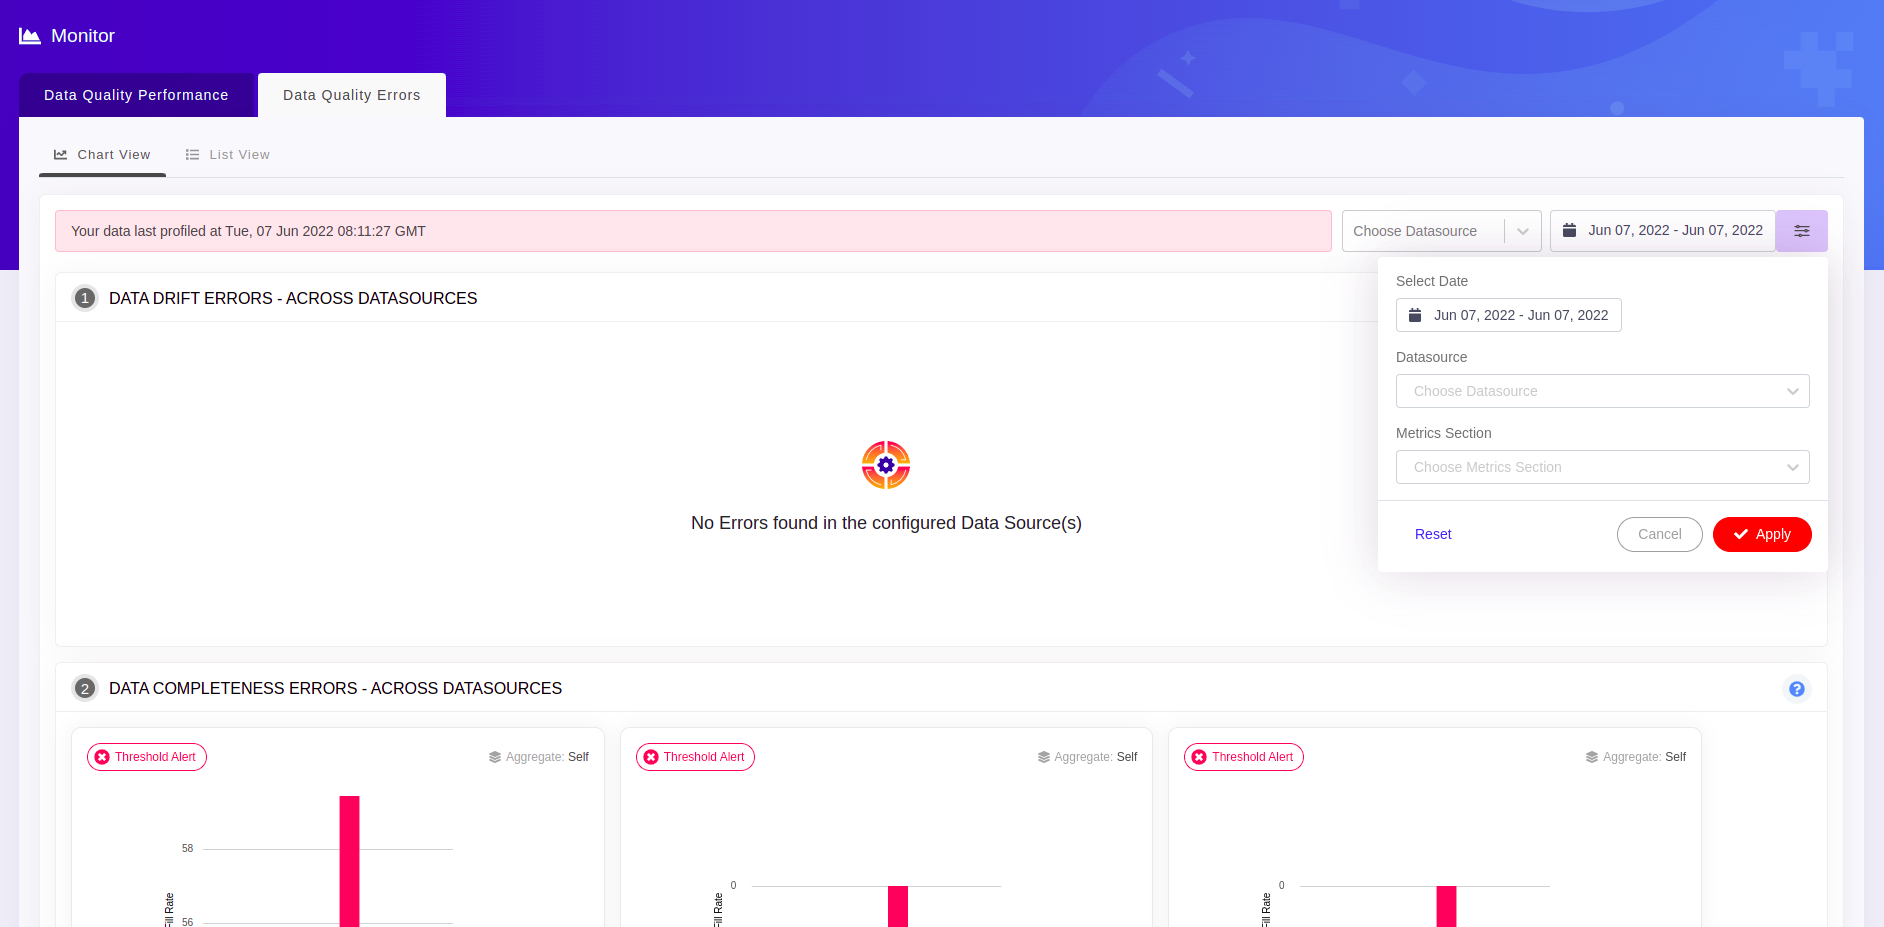
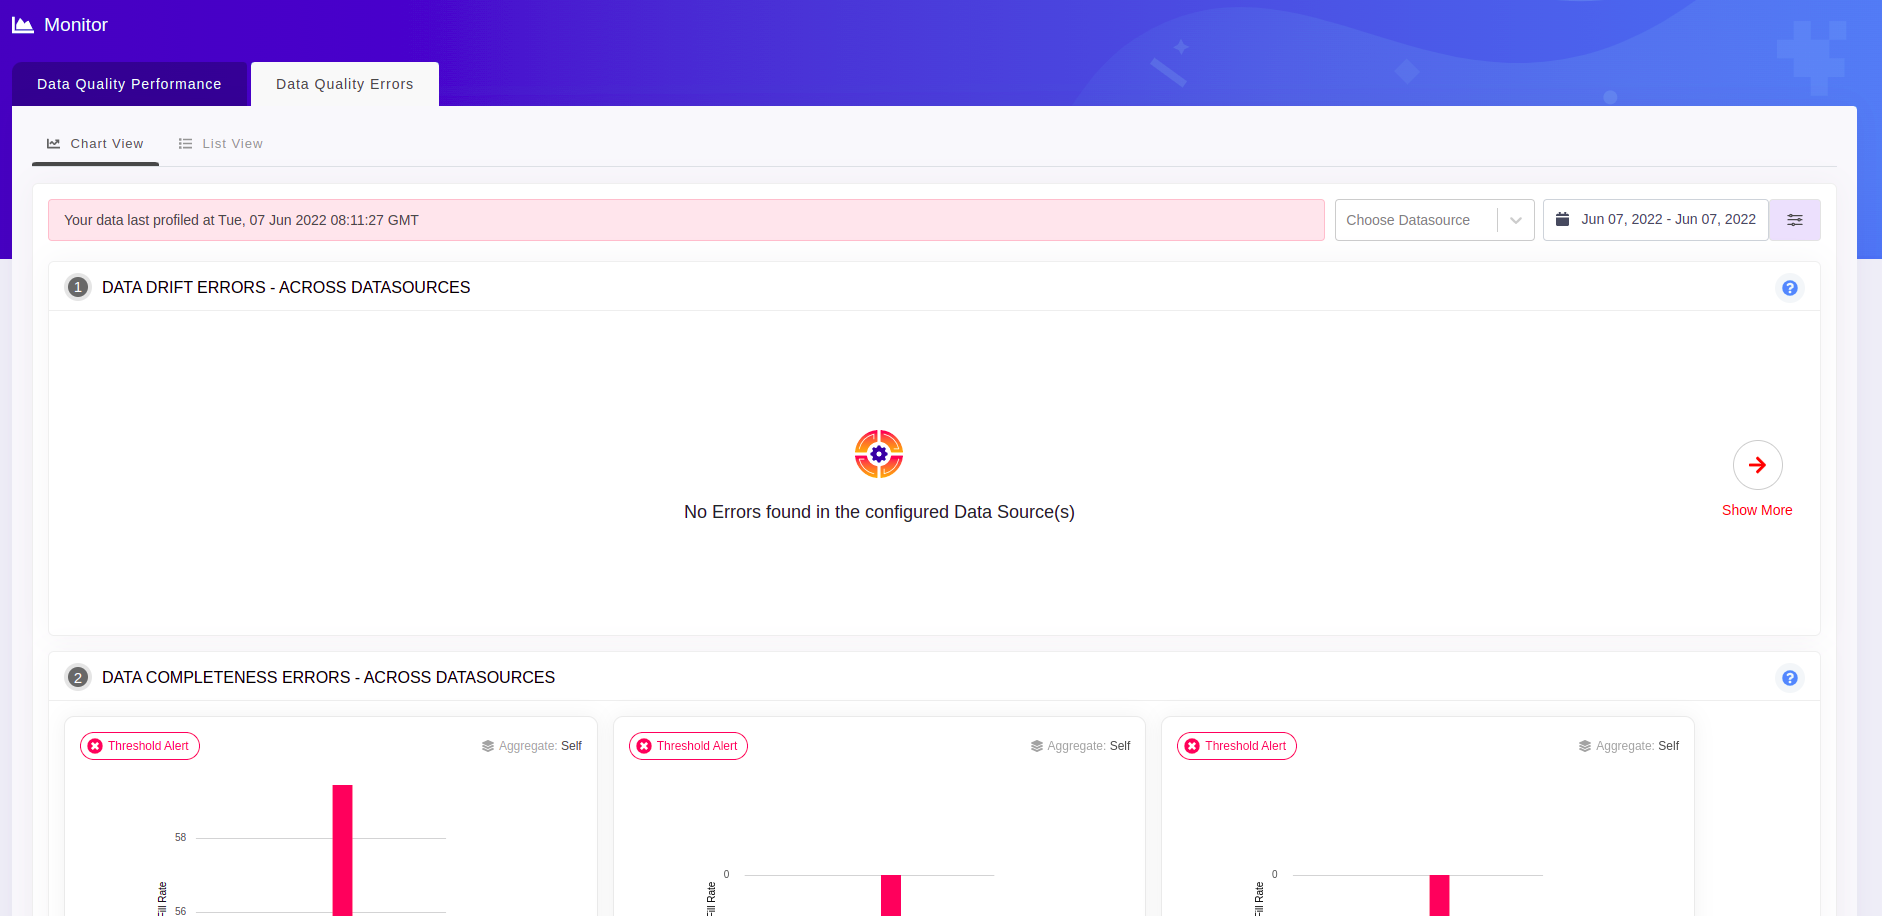
Datasets and attributes in the configured Datasources are monitored on the Data Quality Errors -> Chart View tab on the Monitor page. Up to three errors across all the configured Datasets will be displayed in each numbered section. The dashboard may be filtered based on Datasource and Metrics Section to view charts for the Datasets from a particular Datasource and metric section(s).
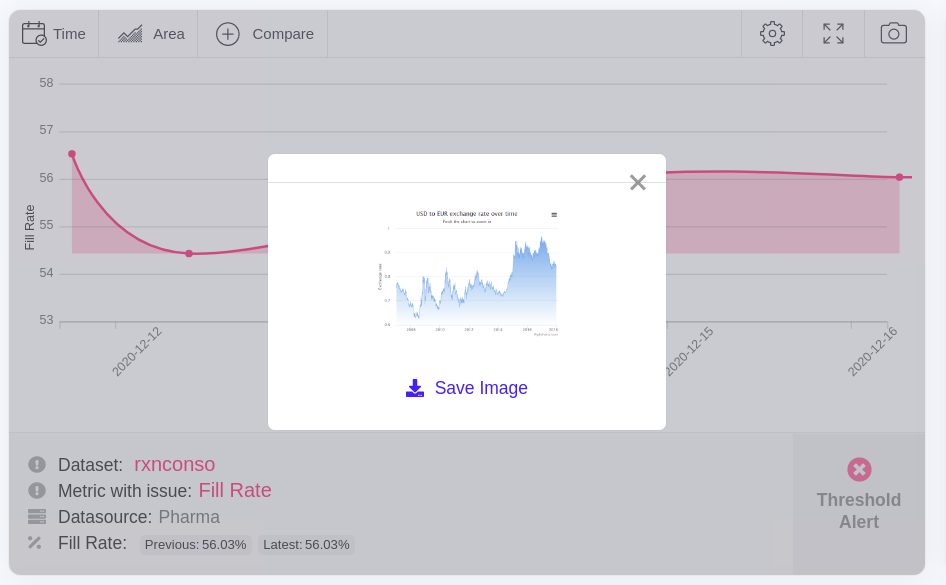
Each chart provides a summary of monitoring activity of a specific metric for a given Dataset. The metric trend will also be highlighted on the chart as a reference for determining appropriate actions.
If there is any problem in the data, the relevant chart element(s) will be displayed in Red. Only charts with error patterns will be displayed if no filter is applied.
Charts are grouped under Metric Groups.
Click on Show More to view all the charts related to the Dataset(s) in the selected Datasource.
To focus on a specific Dataset/Attribute/Metrics apply appropriate filters available at the right top and select the options of interest.
Each chart has relevant filtering options such as Chart Type, Compare, and Timeline to add insight regarding the changes in the metrics result over time. Qualdo also allows the user to save the chart as an image by clicking the Camera icon.
List View
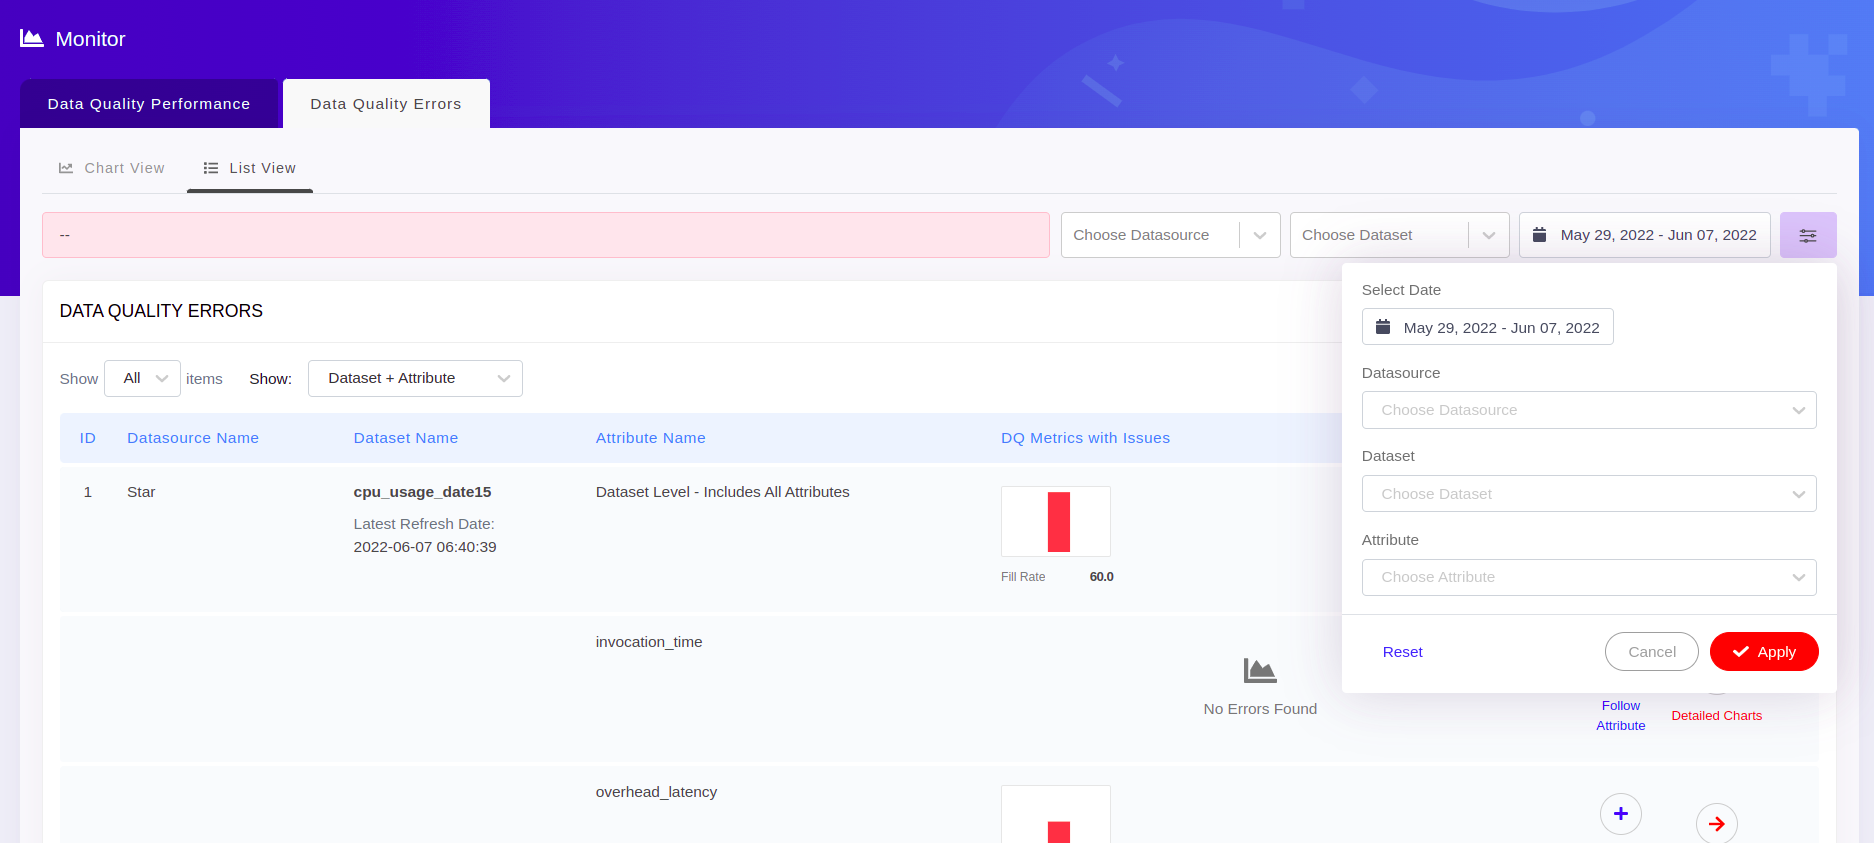
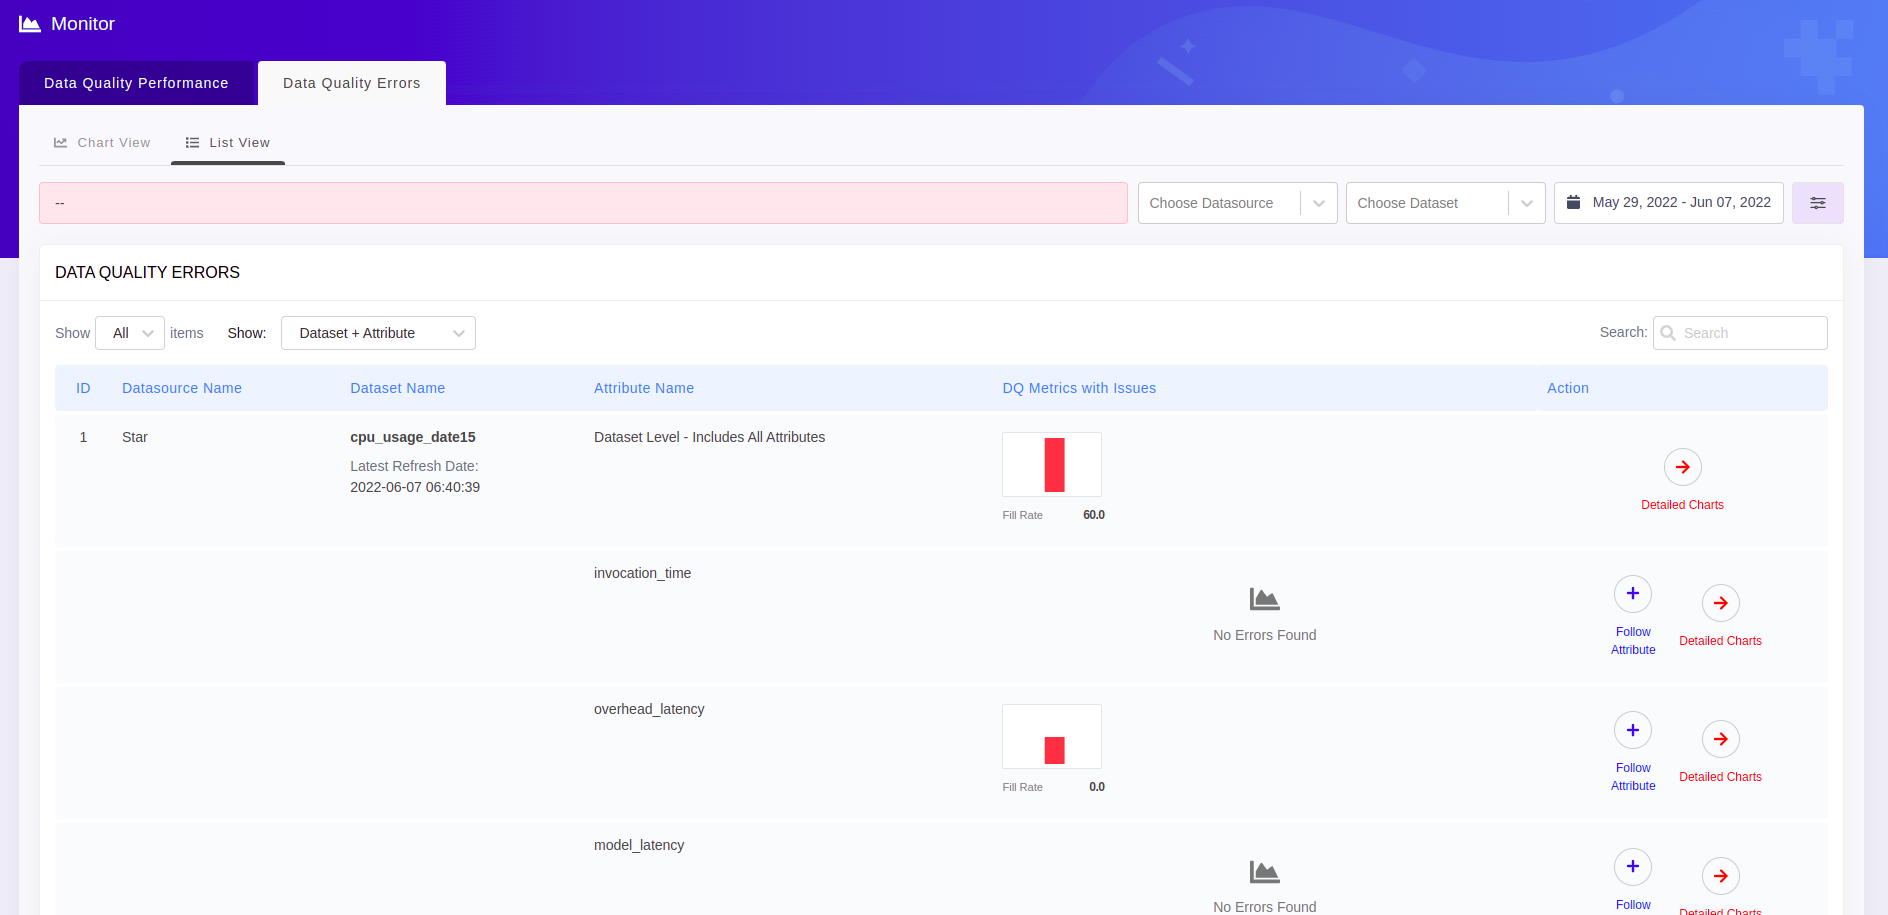
Datasets and attributes in the configured Datasources are monitored on the Data Quality Errors -> List View tab on the Monitor page. By default up to 50 errors will be displayed on a page. All the attributes and the Datasets having errors in the configured datasources will be listed. The table may be filtered by Datasource, Dataset and Atrributes to view a filtered error summary for the Dataset(s) and Attributes.
By adding or removing attributes to/from the Following Attribute list, one may monitor the metrics for the set of attributes of their interest.
By using the Show filter on the Data Quality Errors table, one may also list the errors for Dataset+Attributes/Dataset Only/Attributes Only/Followed Attributes Only
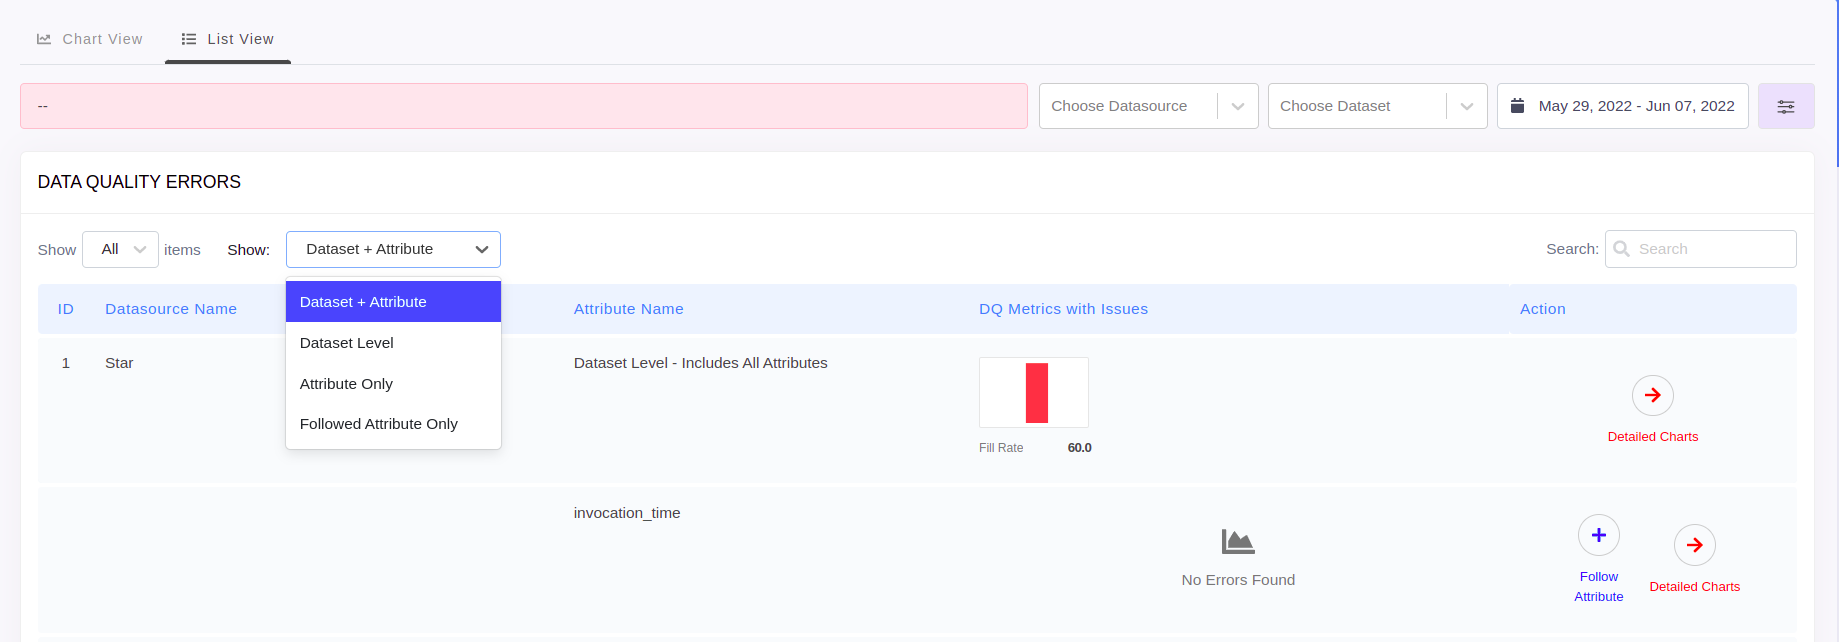
The Table is organised to display a Dataset error summary. Errors at the Dataset level are in the first row, followed by their attributes with the errors. Each row displays the thumbnail view of the error chart(s) at the Dataset or Attribute level.
A maximum of seven datapoints are displayed in the thumbnail charts, within the time range that has been selected. Click on Detailed Charts icon to view all the errors charts in detail. In the detailed chart view a maximum of 30 data points are displayed for the selected the time range.
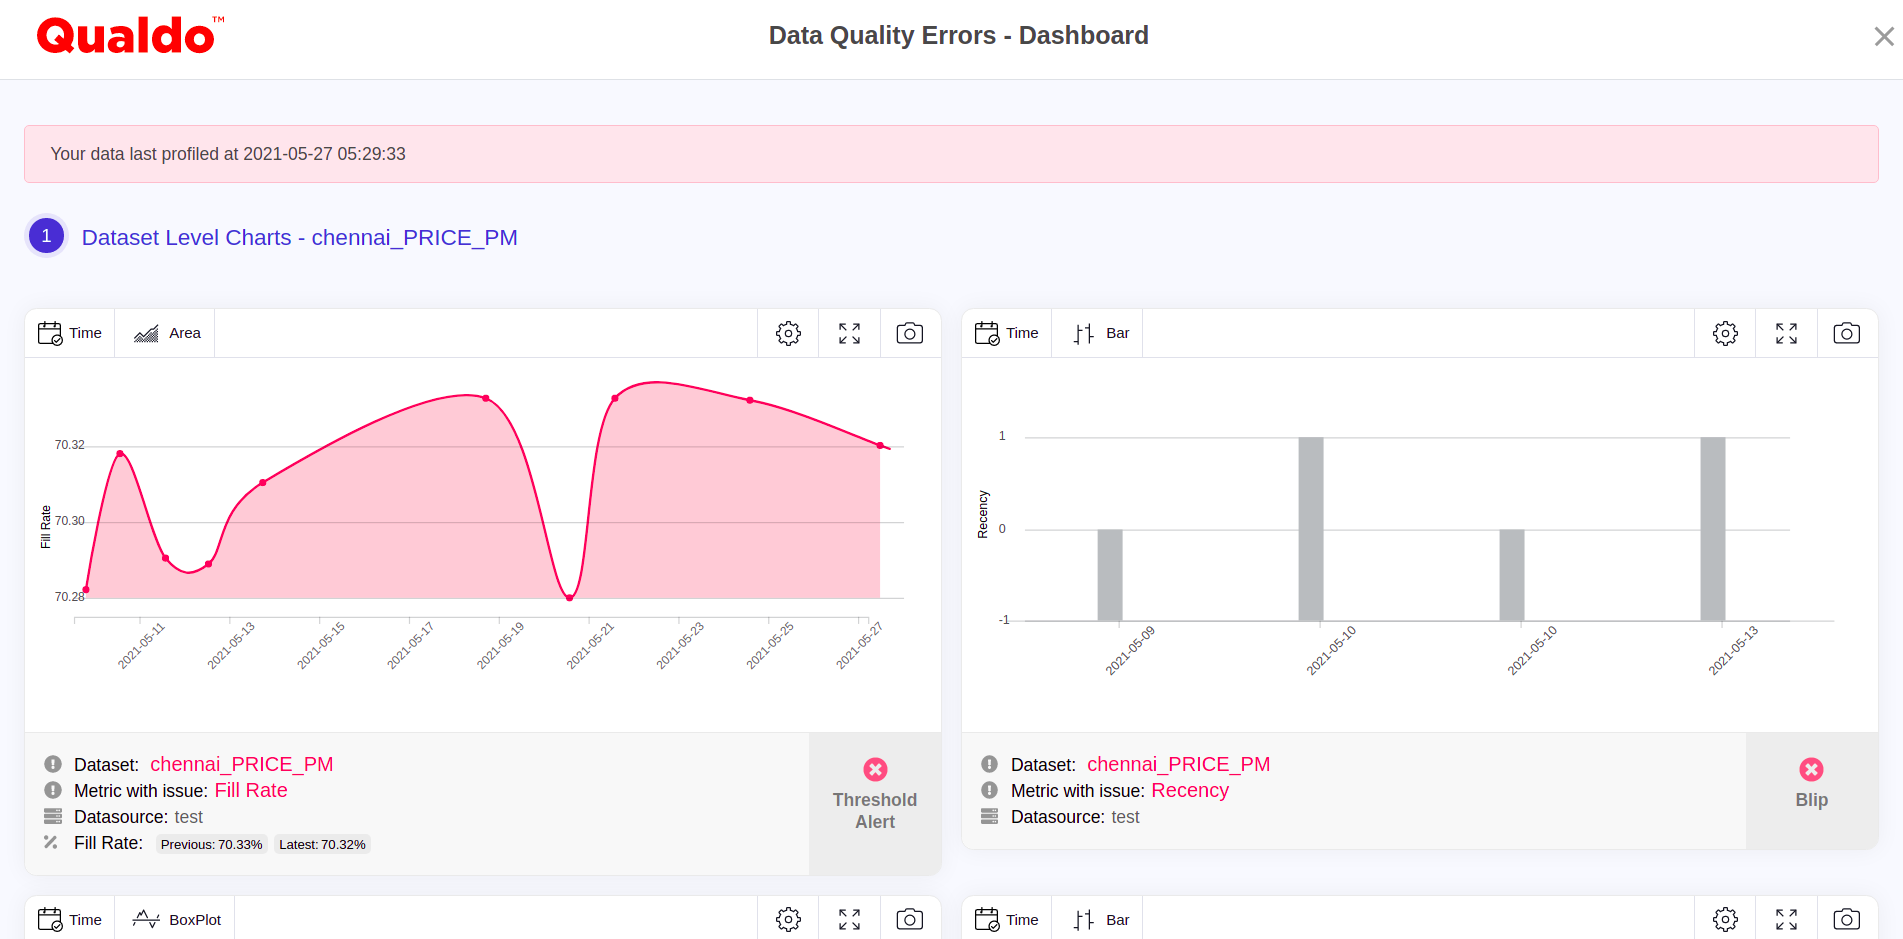
On clicking Detailed Charts icon at the Dataset level row, displays all the detailed error charts at Dataset level as well as each section at attribute level to display the attribute error charts.
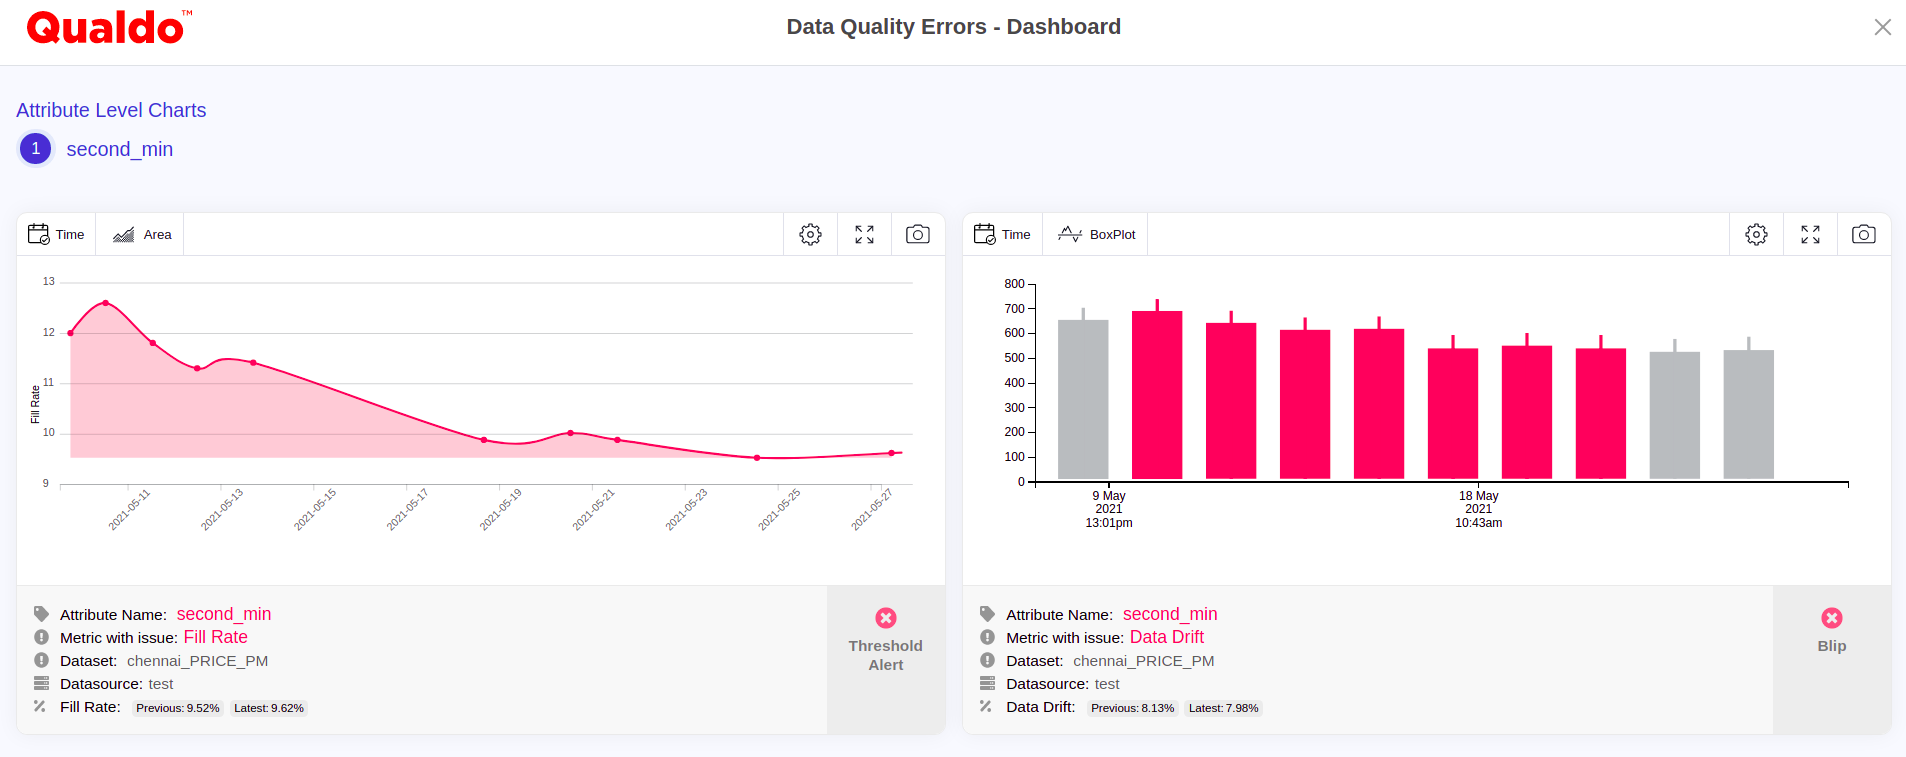
On clicking the Detailed Charts icon at the attribute level, detailed errors charts for that particular attribute will be displayed.
To focus on a specific Dataset/Attribute/Metrics apply appropriate filters available at the right top and select the options of interest.