Monitor
Software applications that control their own database stabilize over time. In the fast-paced world of cloud computing and ever-increasing quantities of data, destabilization is the rule.
Shift, drift and all manner of change is quite simply to be expected, and therefore must be managed - at scale.
Monitor: Data Quality Errors
Data Quality Metrics
Data Quality is monitored using Default and/or Custom Data Quality Metrics. To learn more about the metrics refer to Data Quality Metrics. The Default Metrics values are converted into percentage for visualization.
Data Quality Error Types
Qualdo highlights the data points in Red when an error has been detected. The error pattern observed will also be highlighted. Following are the types of Data Quality errors Qualdo monitors:
When the metric value violates the threshold, this is highlighted as an error. The current metric threshold can be viewed from the metric flashcard available in the Metrics page. To edit the threshold refer to how to redefine the Default Metrics.
When the metric value drifts more than the Qualdo defined range, it will be detected as an error and highlighted, as it may potentially cause issues in the future.
Error Thresholds
An error threshold will be assigned to each Default Metric and Custom Metric. Errors will be detected based on the threshold values assigned to the metrics. Following are the two types of thresholds Qualdo supports:
Metrics Threshold - Threshold limit for the metric value. For Default Metrics this will be represented in percentage.
Drift Threshold - Threshold limit for the drift on the metric value. For Default Metrics this will be represented in percentage.
Metric Patterns
Errors and Patterns in this context are based on the value of a metric relative to a threshold or pattern.
Qualdo graphs the metric data and maps and highlights the quantified metric trend over time. Following are the types of metric patterns supported in Qualdo.
Sudden - When the metric pattern has fallen or risen at a point and continues in a straight line.
Blip - When the metric pattern looks like a triangle or inverted V.
Threshold Error - When the metric violates the error threshold limit.
Incremental - When the metric values are increasing consistently.
Decremental - When the metric values are decreasing consistently.
Default Metrics
- Data Drift
Data Drift is a metric to monitor how the properties of the different versions of the data vary from each other. Data drift is computed at the Dataset as well as at the attribute level. When the metric value exceeds the threshold limit, then it is considered an error and highlighted in red with the error pattern identified.
- Data Completeness
Fillrate is a metric to monitor whether desired data present or not. Fillrate is computed at the Dataset as well as at the attribute level. When the metric value goes below the threshold limit it is considered an error and highlighted in red with the error pattern identified.
Row Count is a metric to capture the number of rows present. Row Count is computed at the Dataset level. Any drift on the metric value is considered an error and highlighted in red with the error pattern identified.
- Data Uniqueness
Uniqueness is a metric to understand whether duplicates present in the data or not. Uniqueness is computed at the Dataset as well as at the attribute level. Any drift on the metric value is considered an error and highlighted in red with the error pattern identified.
- Data Timeliness
Recency is a metric to monitor the age of your Dataset file. Recency is computed at the Dataset level. When the metric value exceeds the threshold limit, then it is considered an error and highlighted in red with the error pattern identified.
- Data Accuracy
Data Outlier is a metric to monitor anomalies/outliers present in the data. Data Outlier is computed at the Dataset as well as at the attribute level. When the metric value exceeds the threshold limit, then it is considered an error and highlighted in red with the error pattern identified.
- Data Conformity
Date Conformity is a metric to monitor the data that is auto-detected as “date” by Qualdo.
SSN Conformity is a metric to monitor the data that is auto-detected as “ssn number” by Qualdo.
Email Conformity is a metric to monitor the data that is auto-detected as “email” by Qualdo.
Gender Conformity is a metric to monitor the data that is auto-detected as “gender” by Qualdo.
Credit Card Conformity is a metric to monitor the data that is auto-detected as “credit card” by Qualdo.
IP Conformity is a metric to monitor the data that is auto-detected as “ip address” by Qualdo.
HTTP Conformity is a metric to monitor the data that is auto-detected as “http code” by Qualdo.
URL Conformity is a metric to monitor the data that is auto-detected as “url” by Qualdo.
Boolean Conformity is a metric to monitor the data that is auto-detected as “boolean” by Qualdo.
All conformity metrics are computed at the Dataset as well as at the attribute level. When the metric value exceeds the threshold limit, then it is considered an error and highlighted in red with the error pattern identified.
- Data Consistency
Categorical Consistency is a metric to monitor whether the categorical data in two different configured Datasets are in sync. When the metric value exceeds the threshold limit, then it is considered an error and highlighted in red with the error pattern identified.
Datatype Consistency is a metric to monitor whether the datatype of all the attributes in two different configured Datasets are in sync. When the metric value exceeds the threshold limit, then it is considered an error and highlighted in red with the error pattern identified.
Normalization Consistency is a metric to monitor whether the numerical data in two different configured Datasets are in sync. When the metric value exceeds the threshold limit, then it is considered an error and highlighted in red with the error pattern identified.
Custom Metrics
- Purpose
The purpose is to support tailored metrics.
- Example
Custom 1
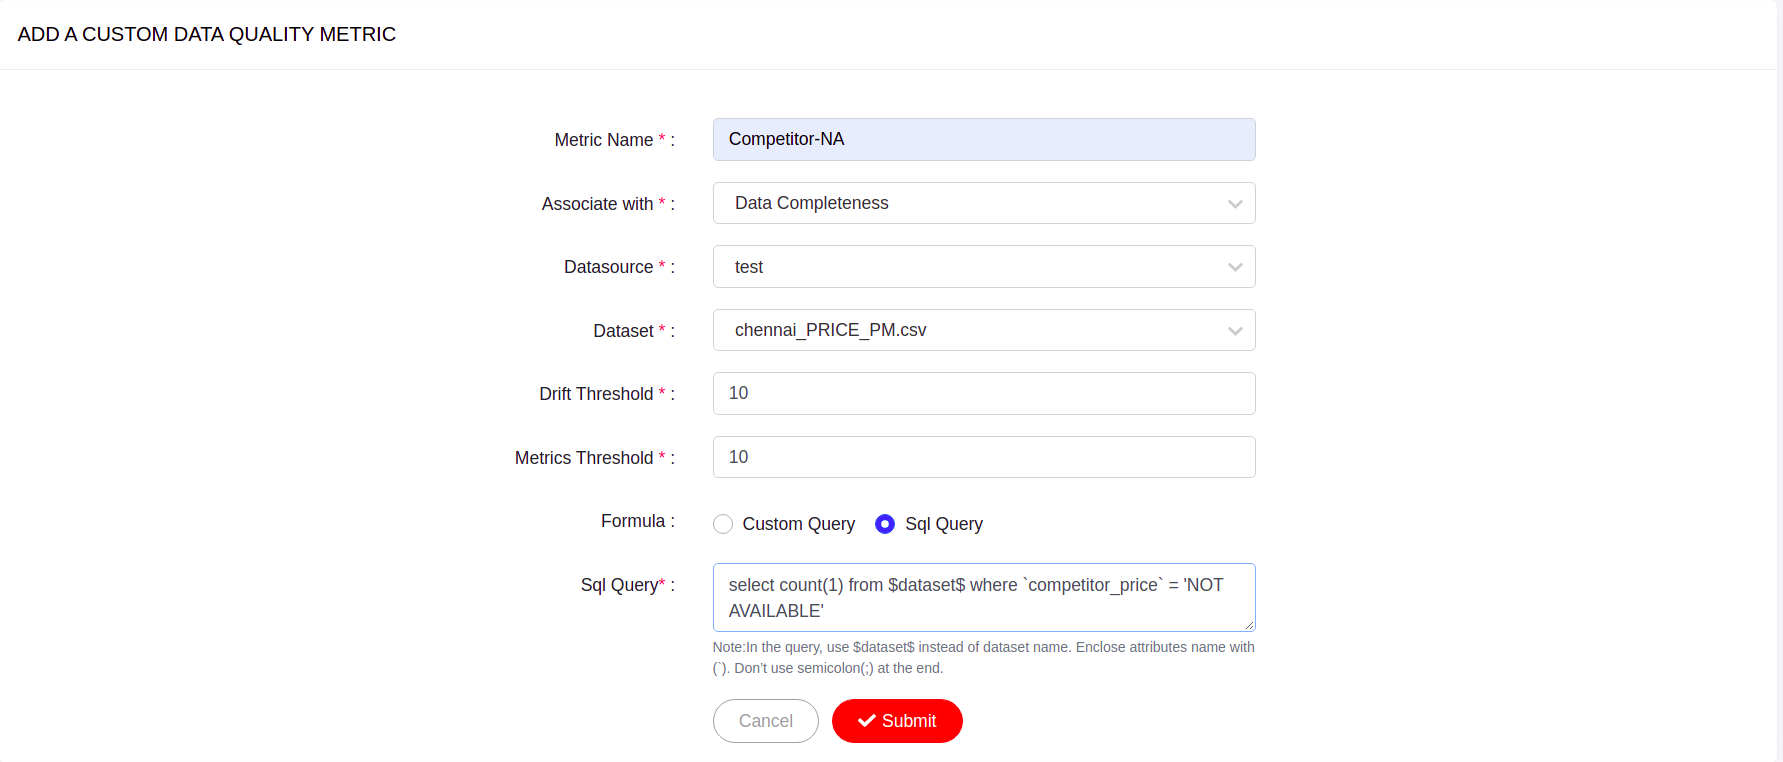
The Custom Metrics in the above image is created to track the count of ‘Not Available’ price from the data. Once Custom Metrics are created and configured with error and drift thresholds, Qualdo will enable monitoring of the created metrics for the specified refresh interval. To learn more about how to create Custom Metrics refer to tutorial on creating Custom Metrics. When the metric value exceeds the threshold limit it is considered an error and highlighted in red with the error pattern identified.