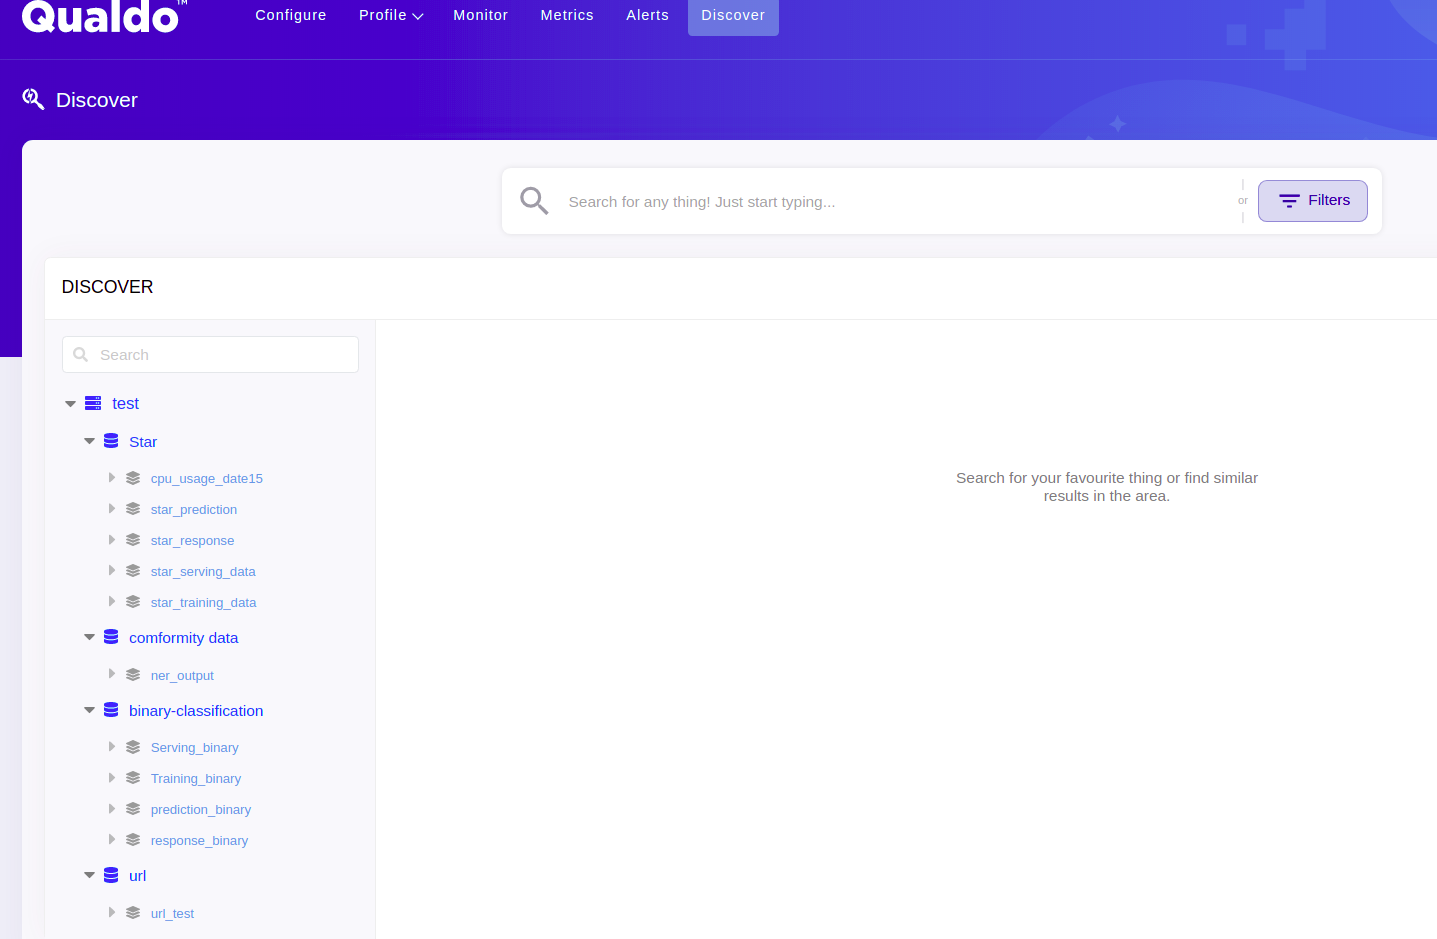
Discover
Overview
- Qualdo helps you to discover the information about particular Environment, Datasource, Dataset and Attributes in a single place. Qualdo also gives you the view on the complete metadata of the configured Datasource(s)*.
One can start typing the name of the entity that they are looking for in the Search box present at the top of all the pages or present in the Discover page.
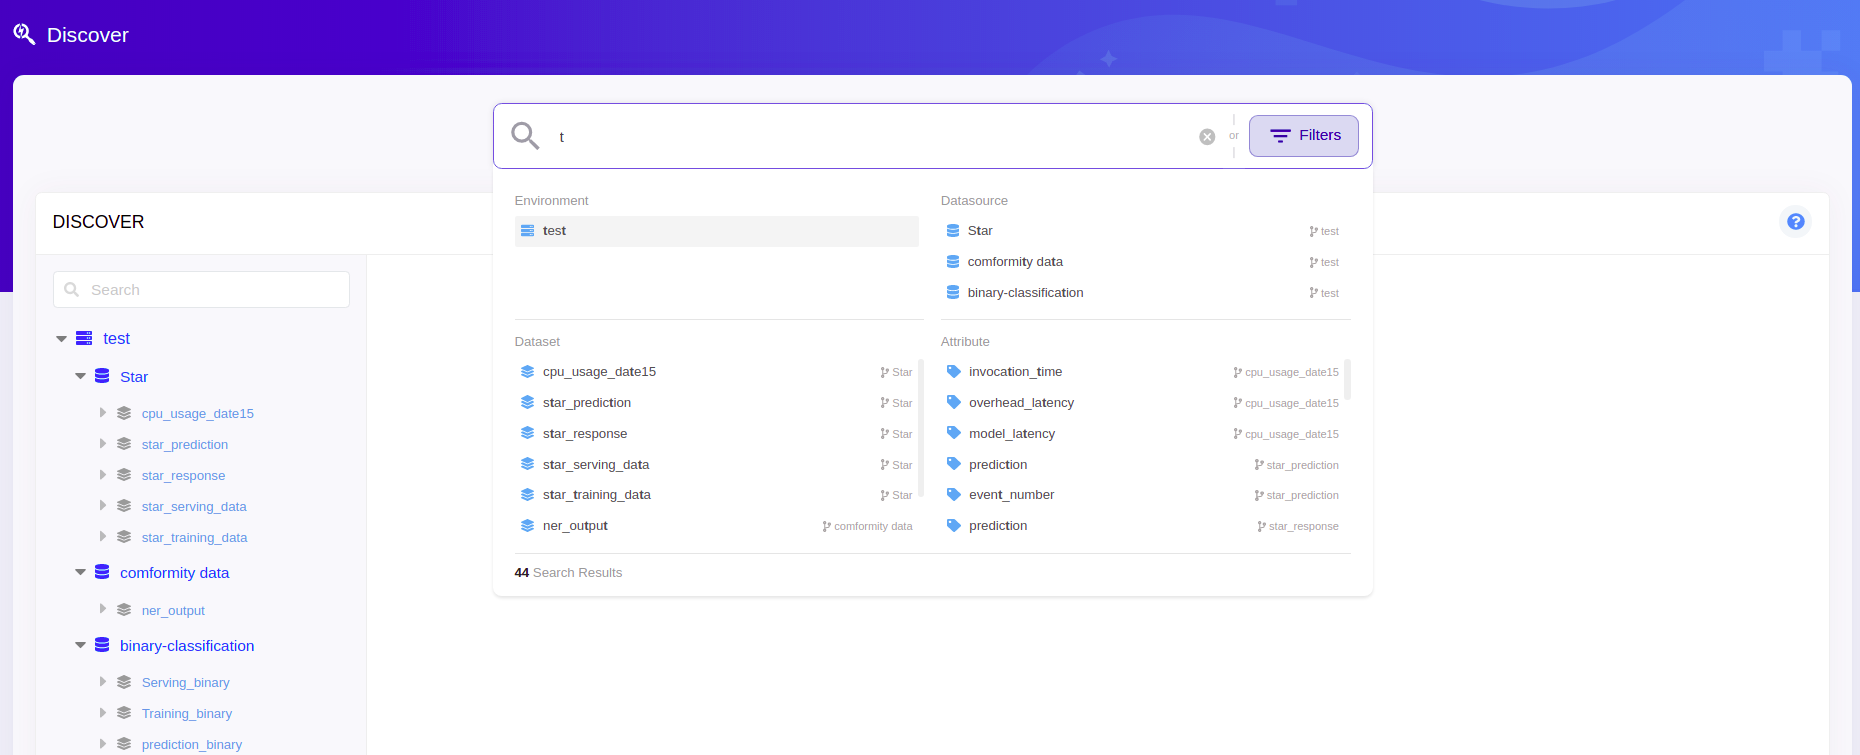
One can also click on Filters button and apply the filters of their interest to discover the information.
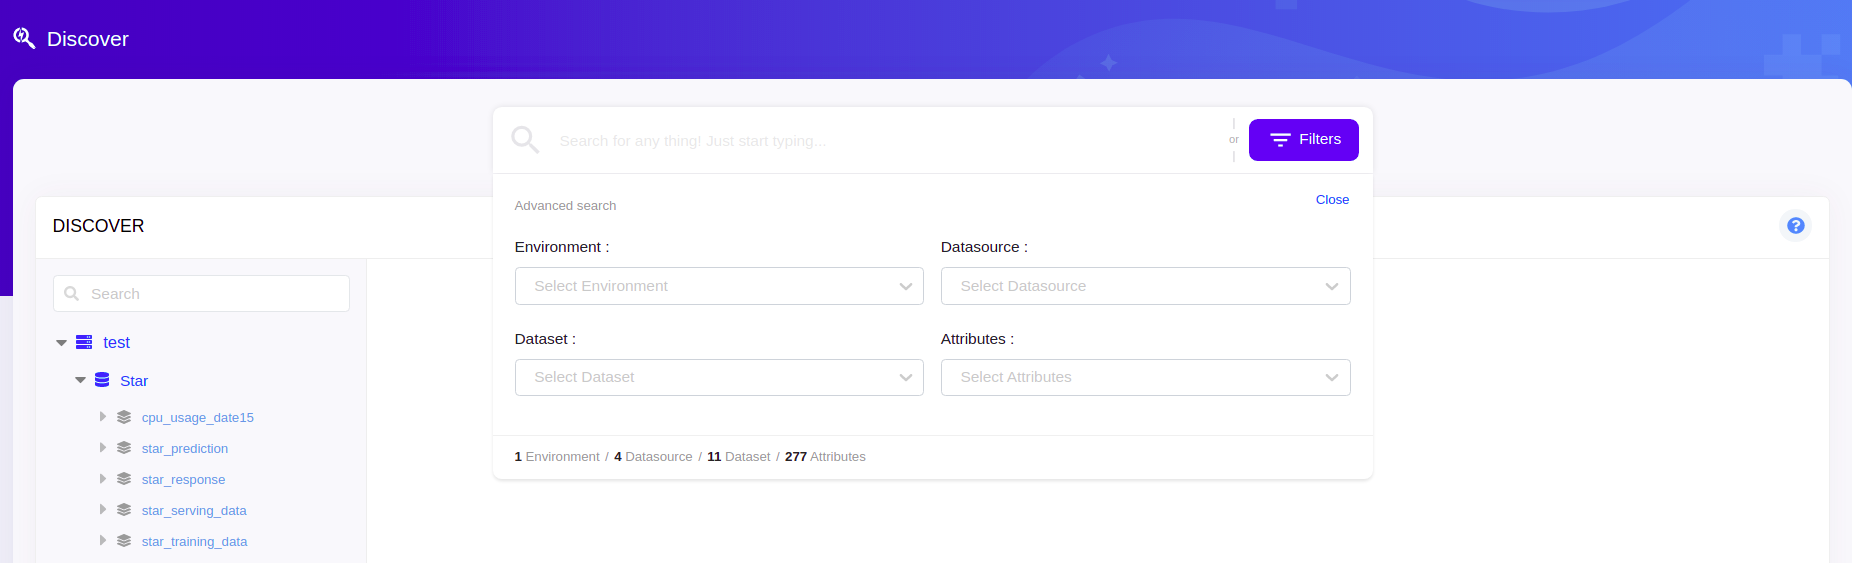
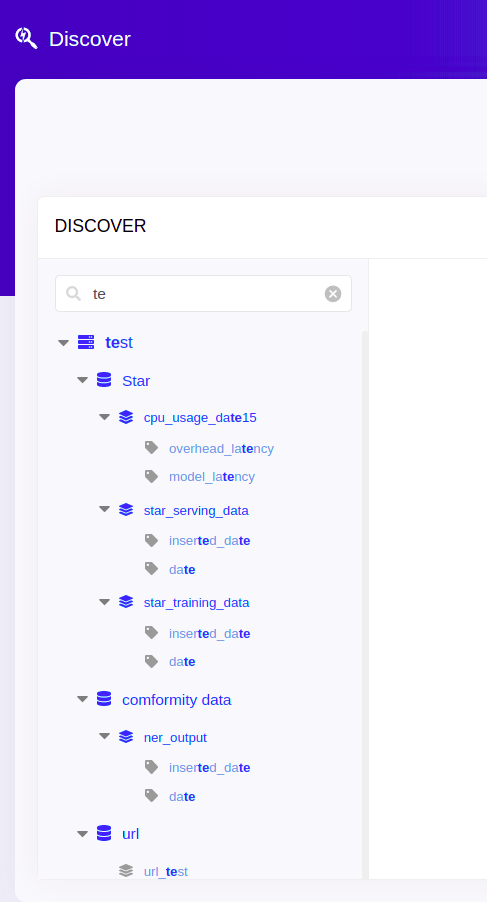
One can also search from the Search box available in the left panel on top of the metdadata tree, where only the matched entities are show in the tree view.
Visualization: Environment
- Visualization gives a quick peek on the summary of the selected environment.
Visualization: Datasource
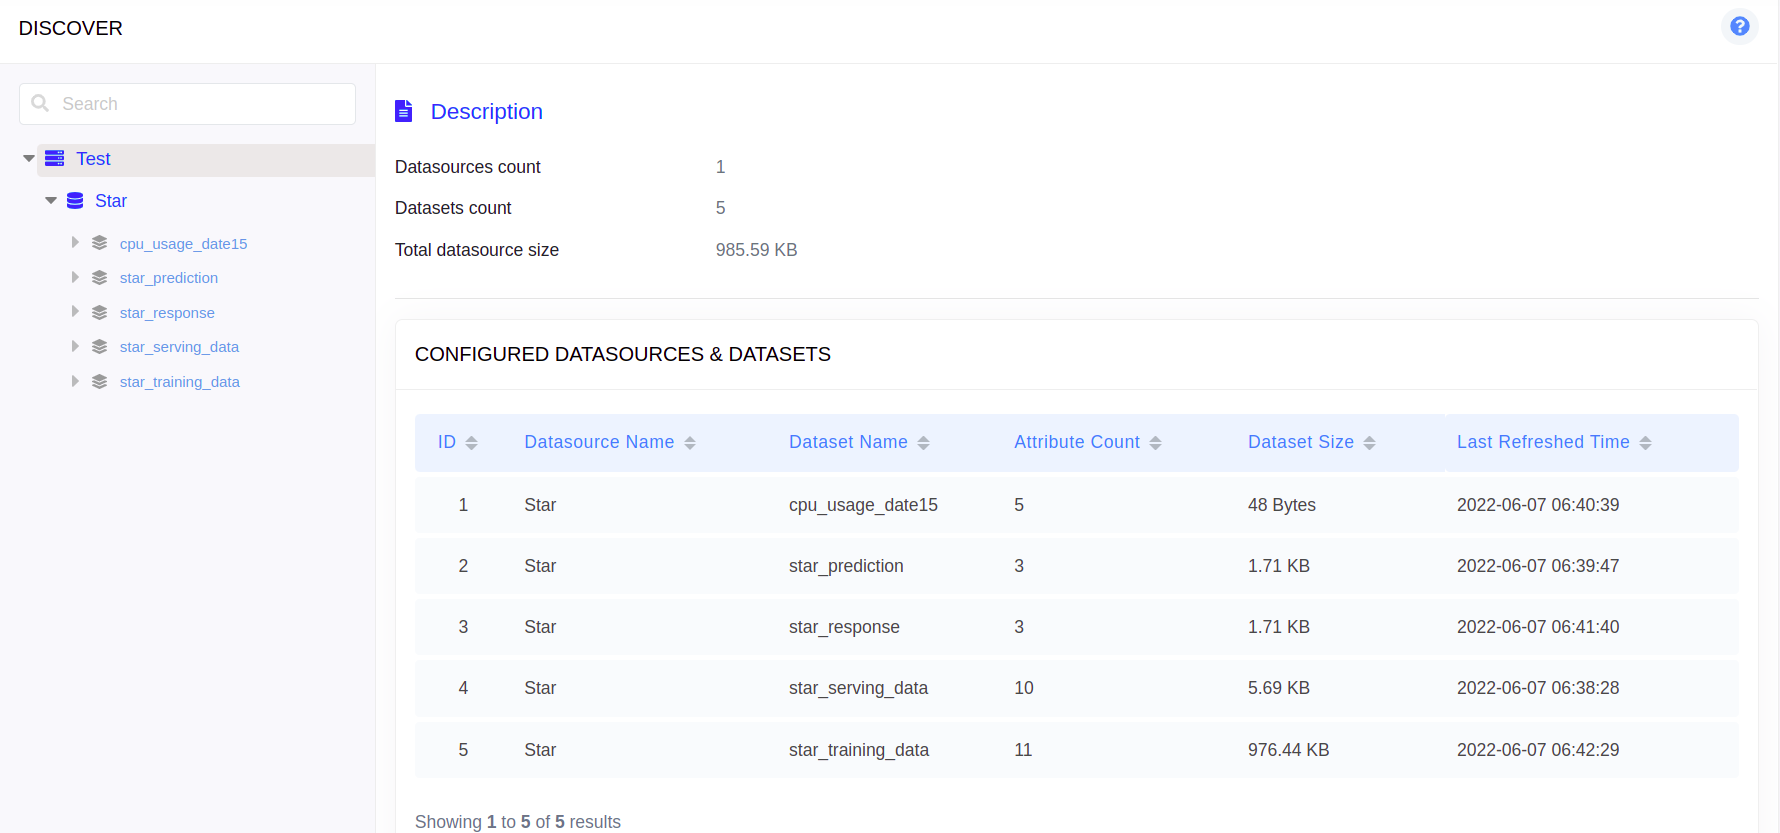
- Visualization gives a quick peek on the summary of the selected datasource.
Relationship: Chart View
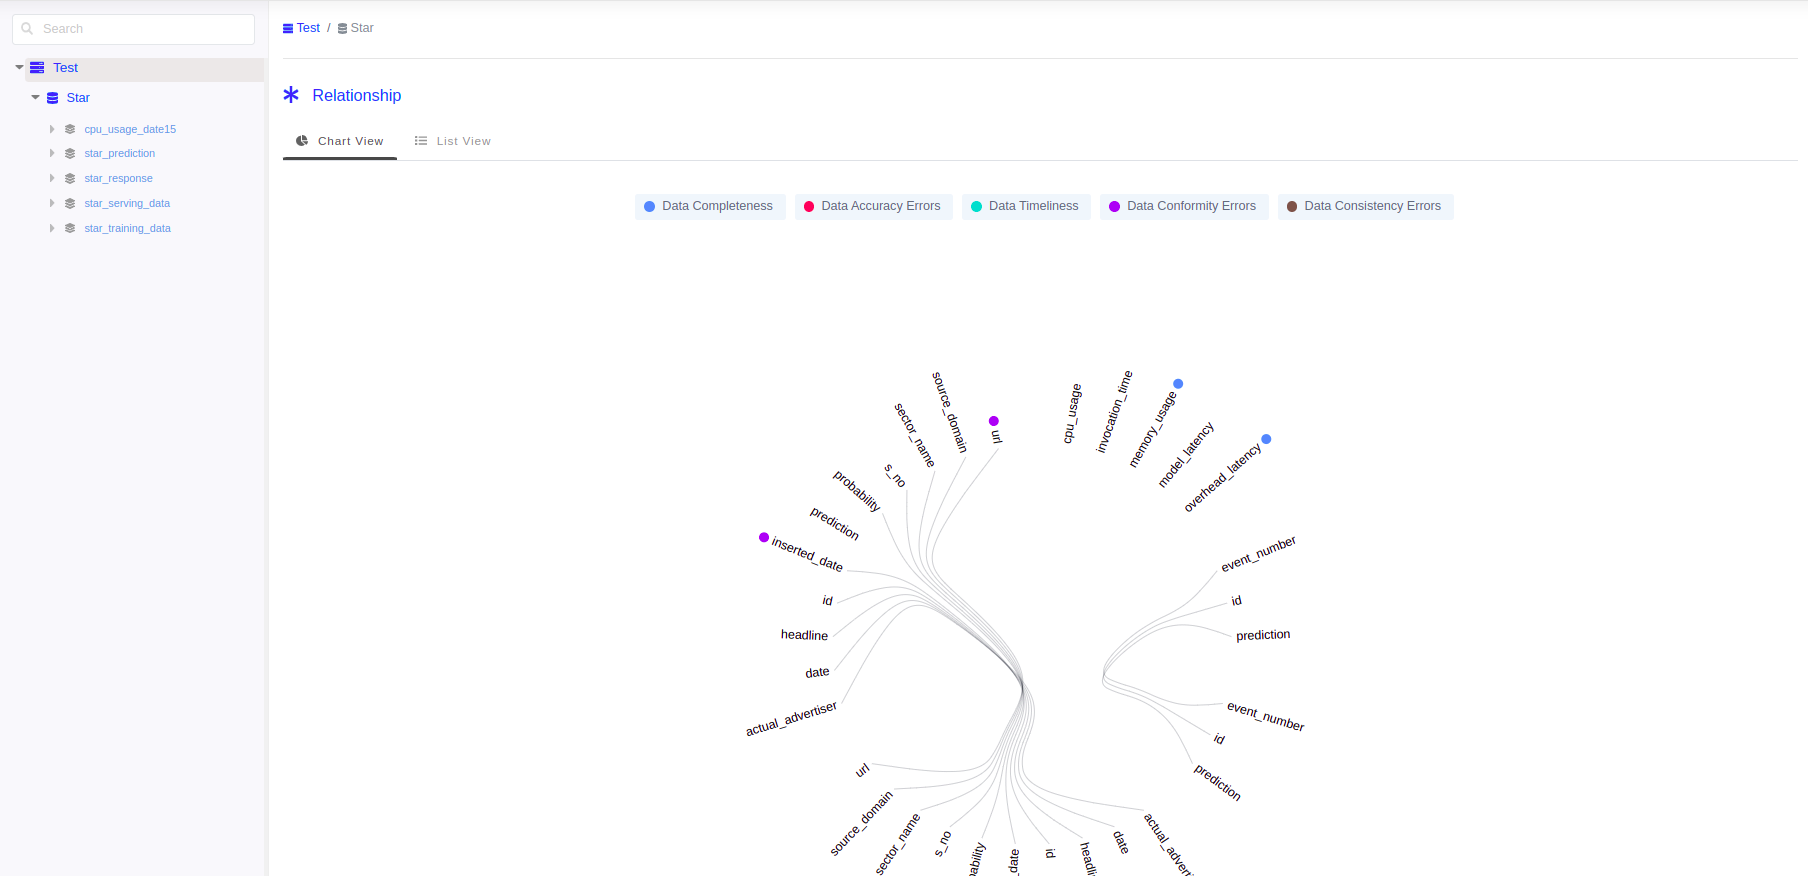
A relation is represented as a line connecting the related attributes.
Attributes are found on the circumference and each group of attributes belongs to a Dataset within the Datasource.
Hover over the attribute to understand about the other attributes they are related to and the confidence score of the relationships. It also shows you details about any errors detected in that attribute.
Different types of errors are represented in a different color next to the attribute and a legend is placed to guide you.
Error-values shown are always the latest errors found on the attributes for the selected time.
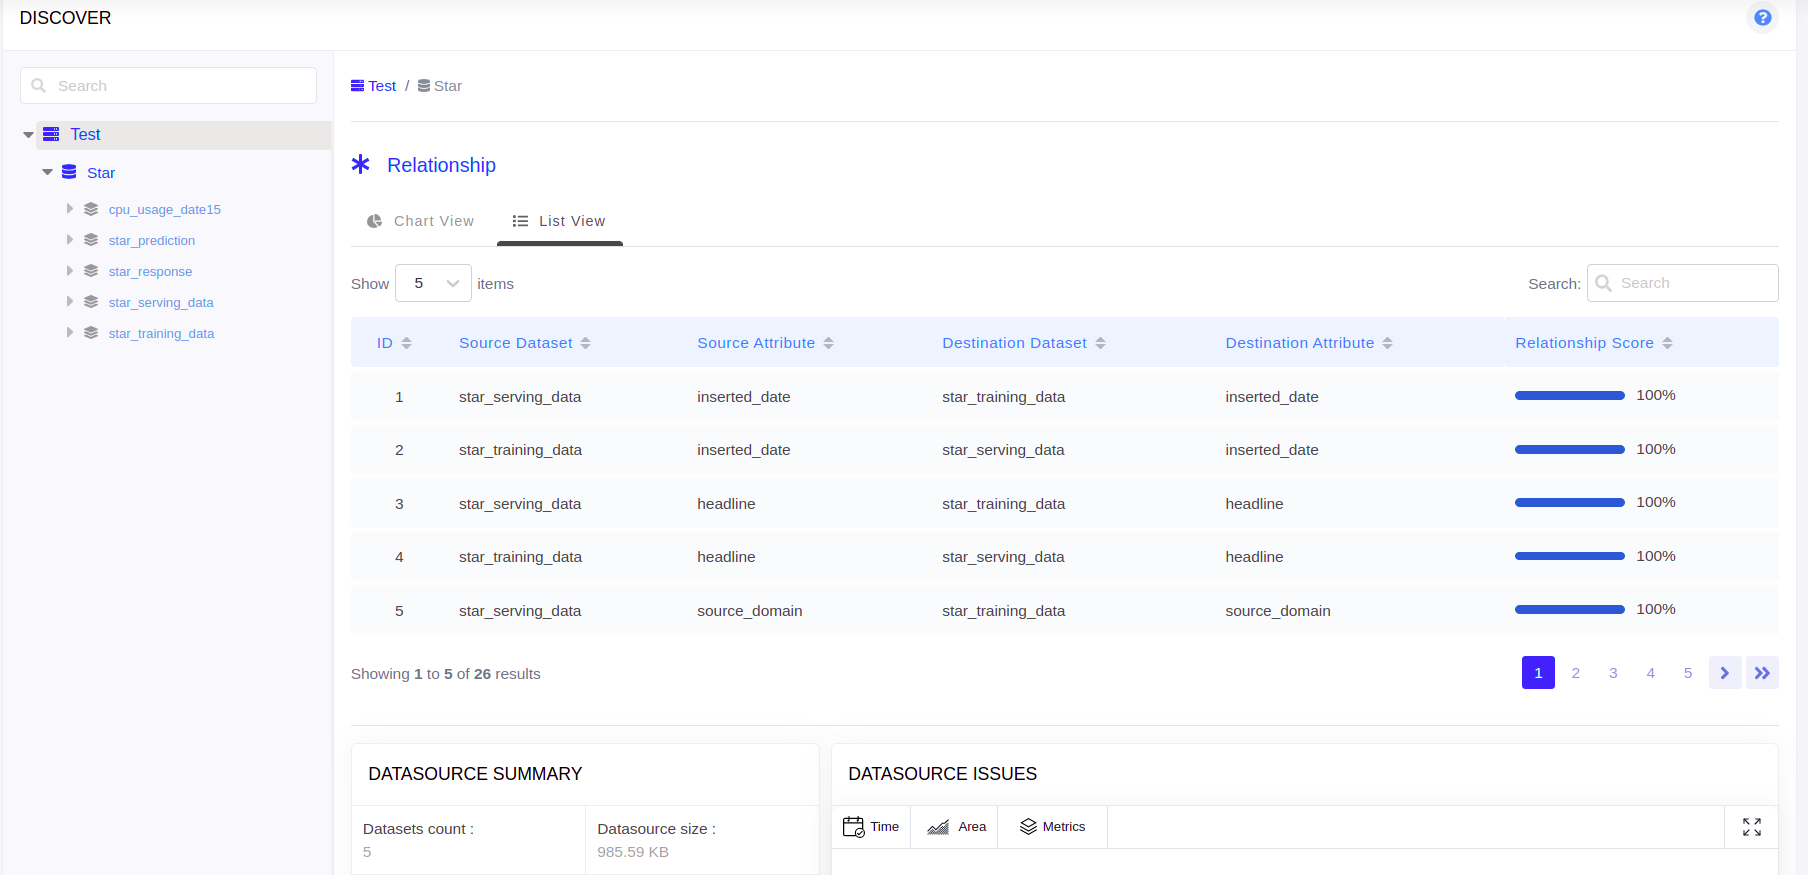
Relationship: List View
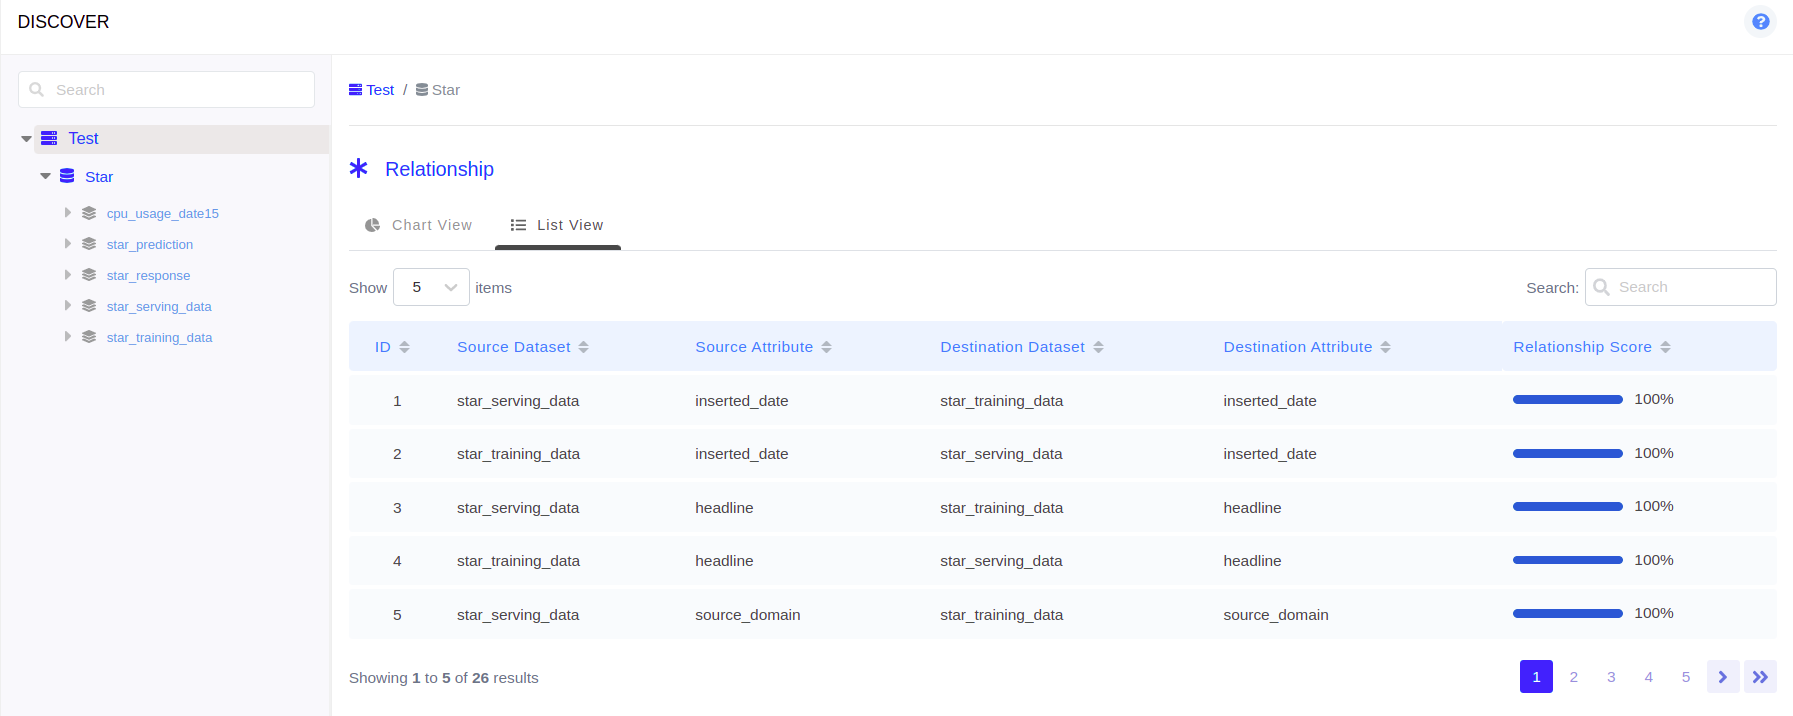
A table view is to get quick access to visualise the relationship between attributes in the different Datasets within the Datasource and its confidence score.
Summary
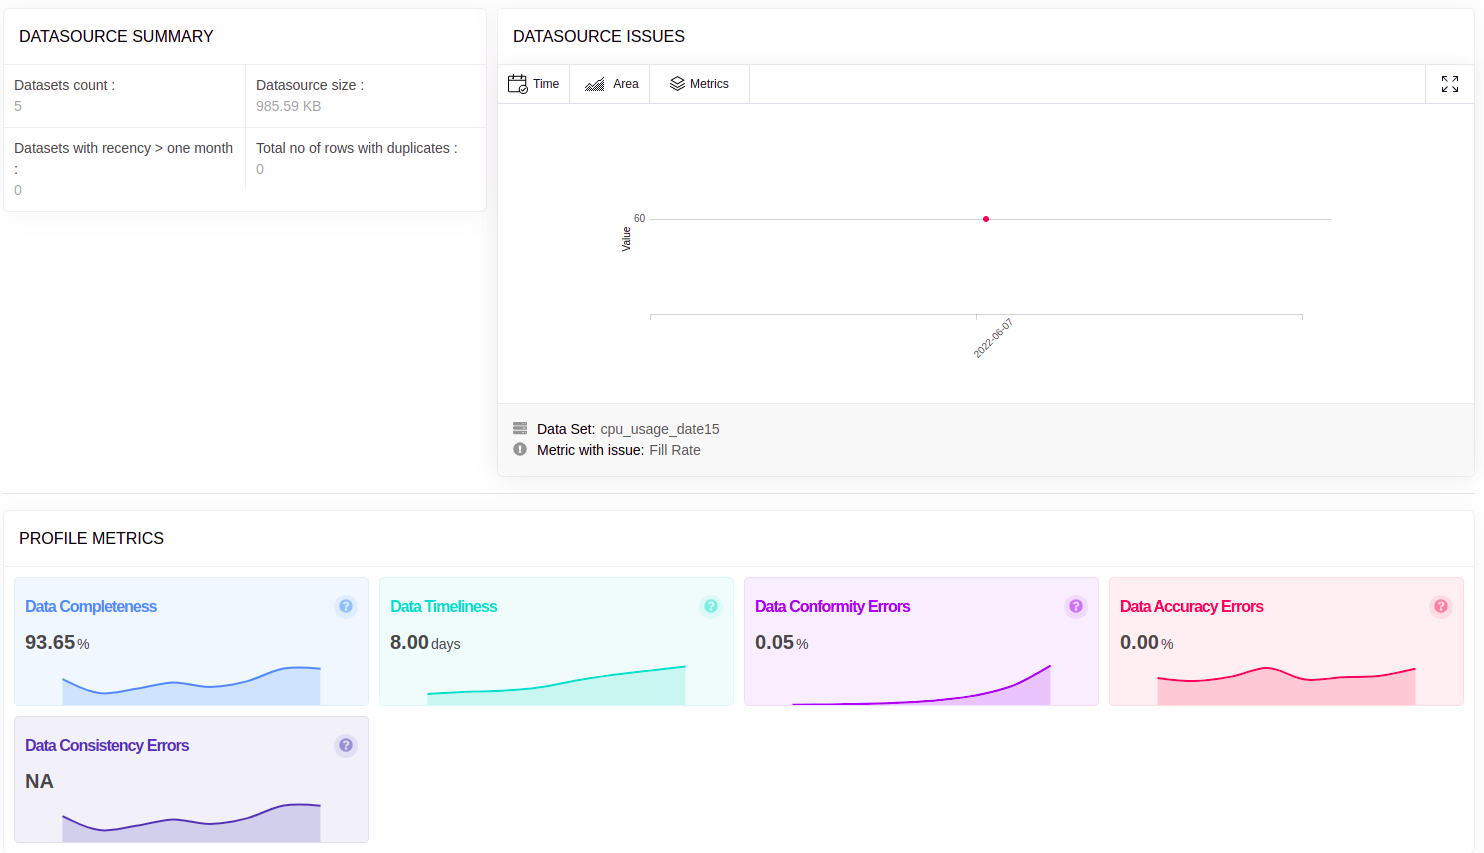
Gives the detailed summary of the Datasource along with the issues present in it.
Visualization: Dataset
Visualization gives a quick peek on the summary of the selected dataset.
Relationship: Chart View
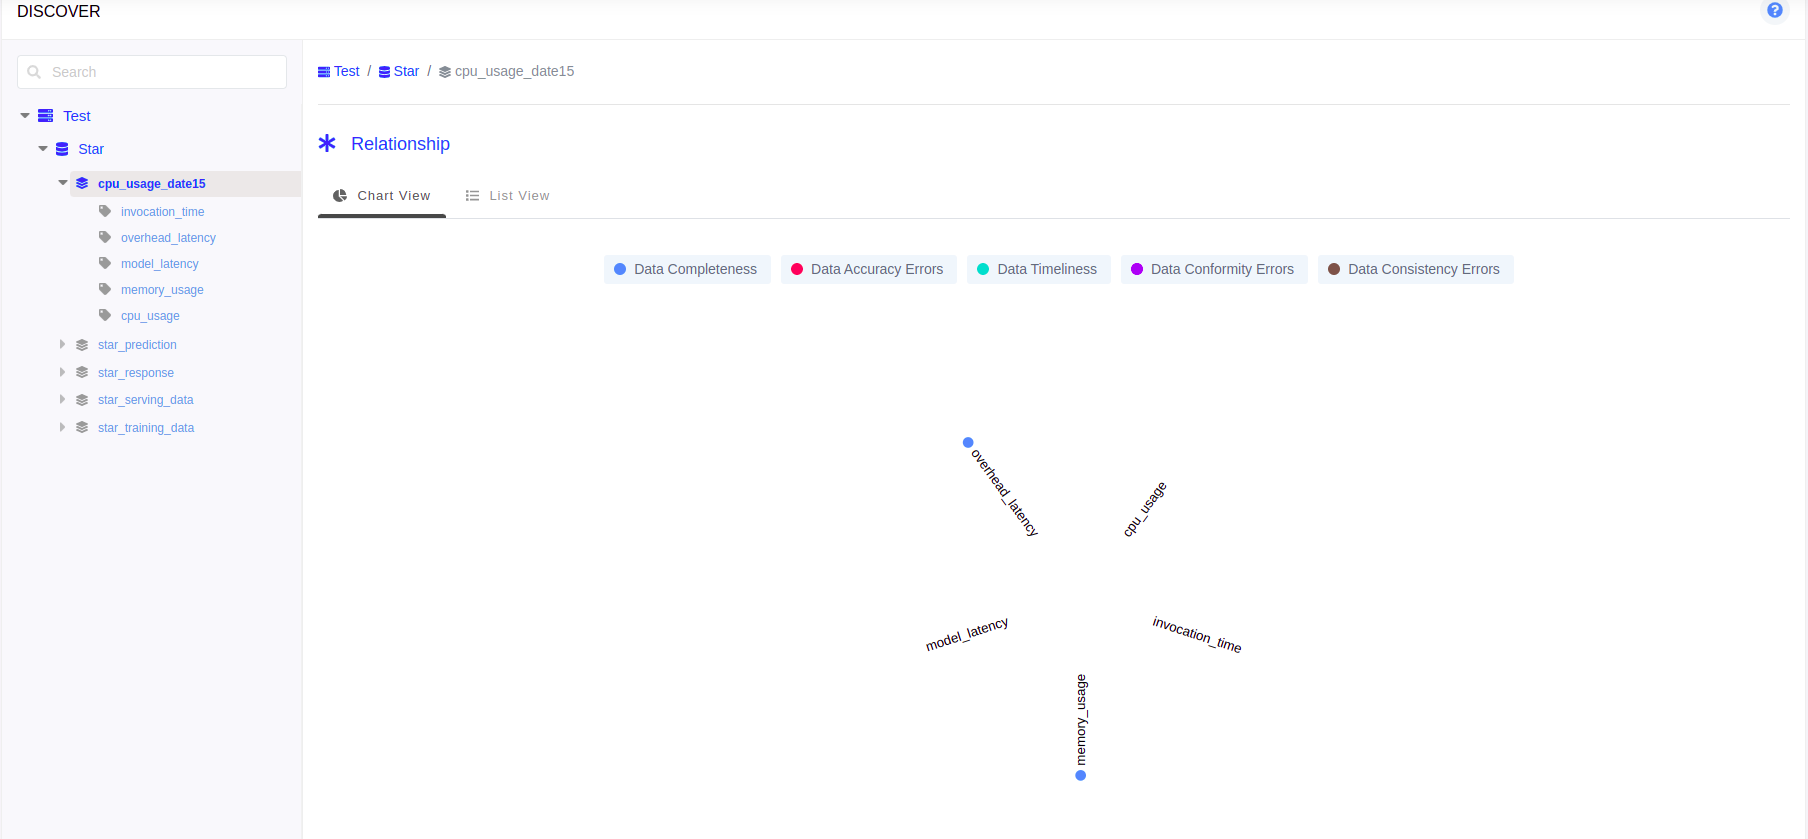
A relation is represented as a line connecting the related attributes.
Attributes are found on the circumference belongs to the selected Dataset.
Different types of errors are represented in a different color next to the attribute and a legend is placed to guide you.
Error-values shown are always the latest errors found on the attributes for the selected time.
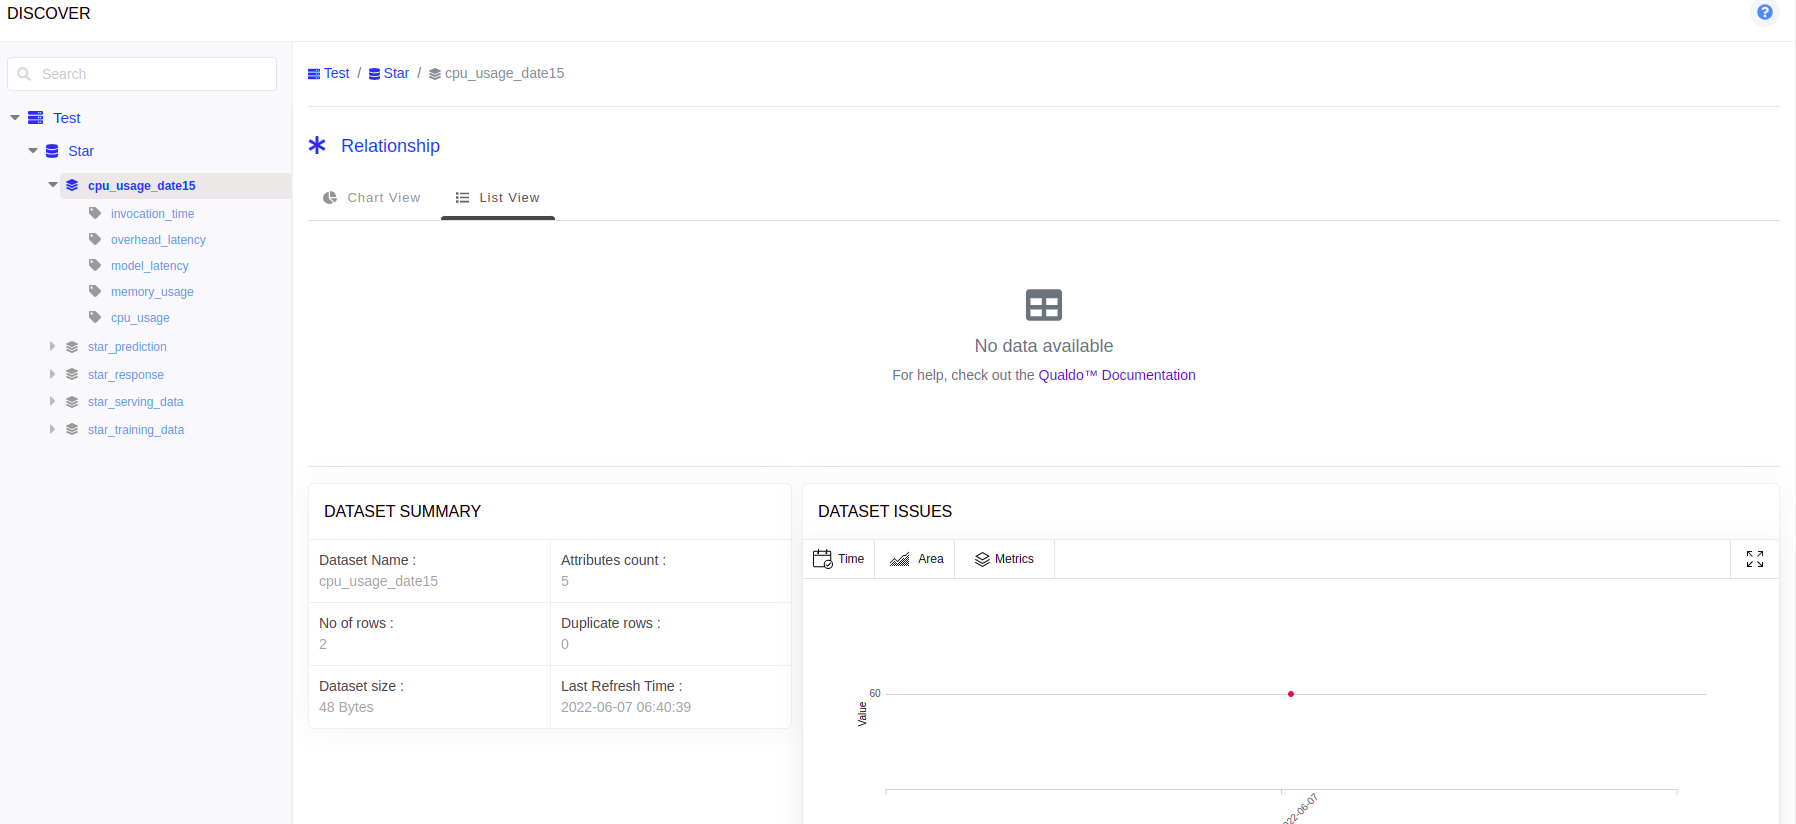
Summary
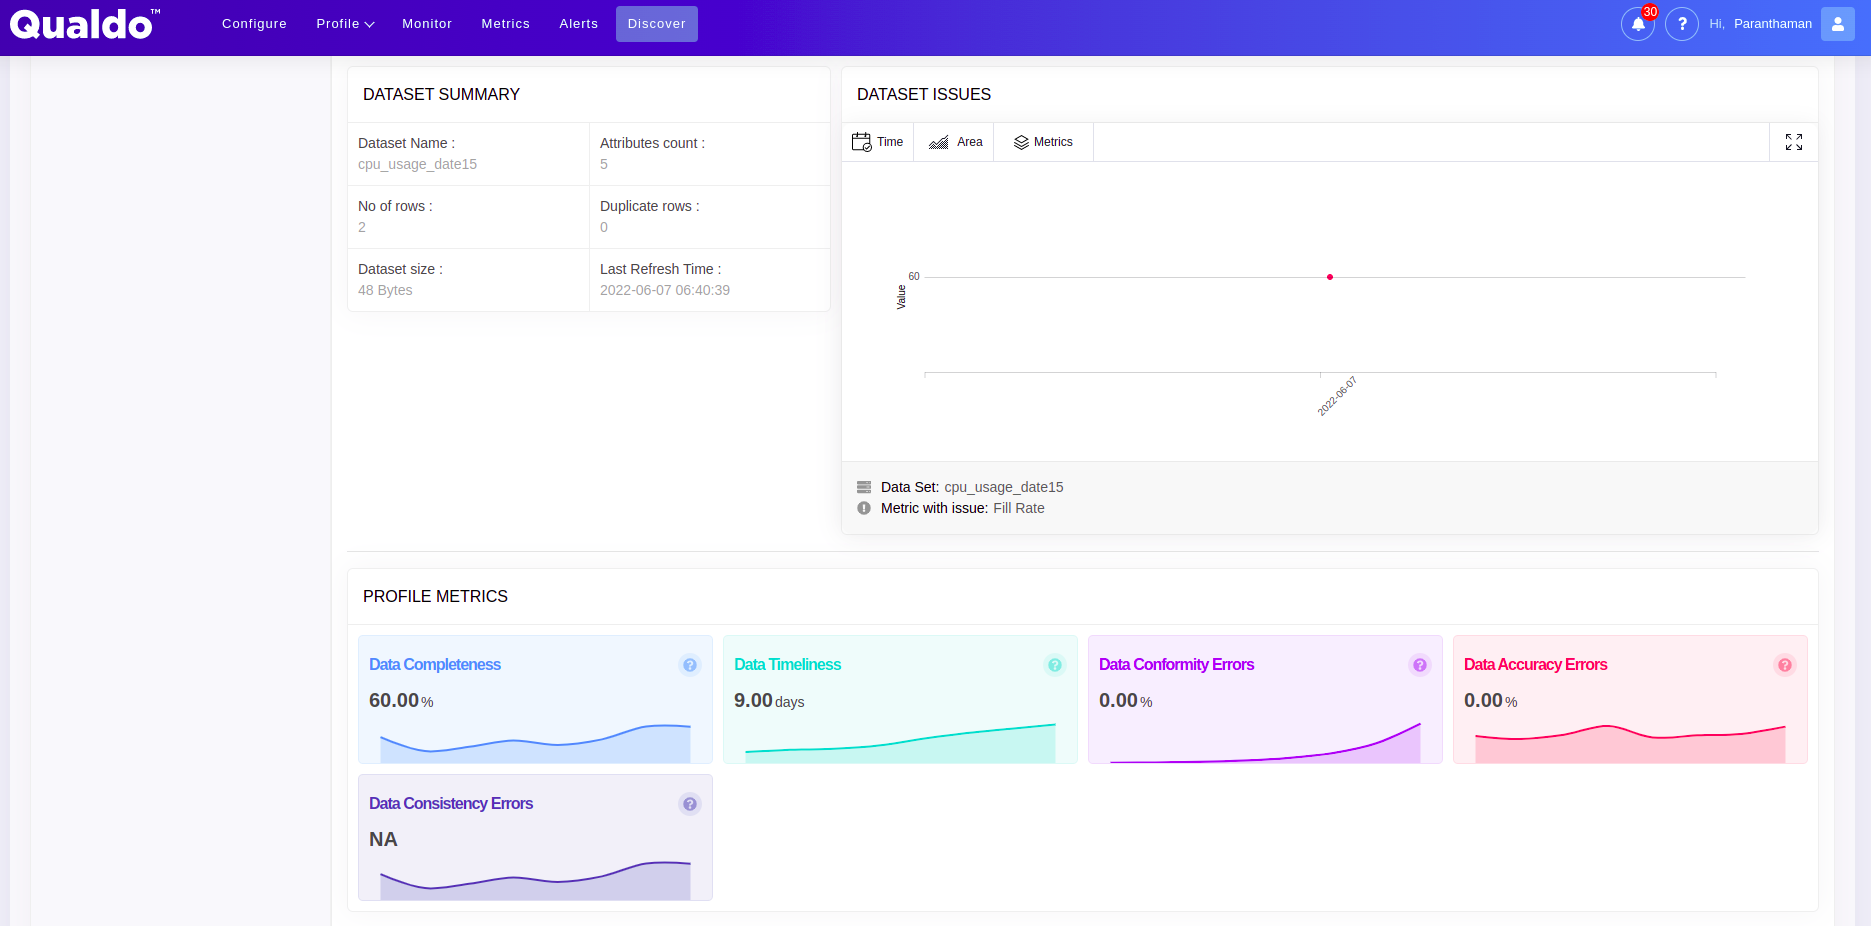
Gives the detailed summary of the Dataset along with the issues present in it.
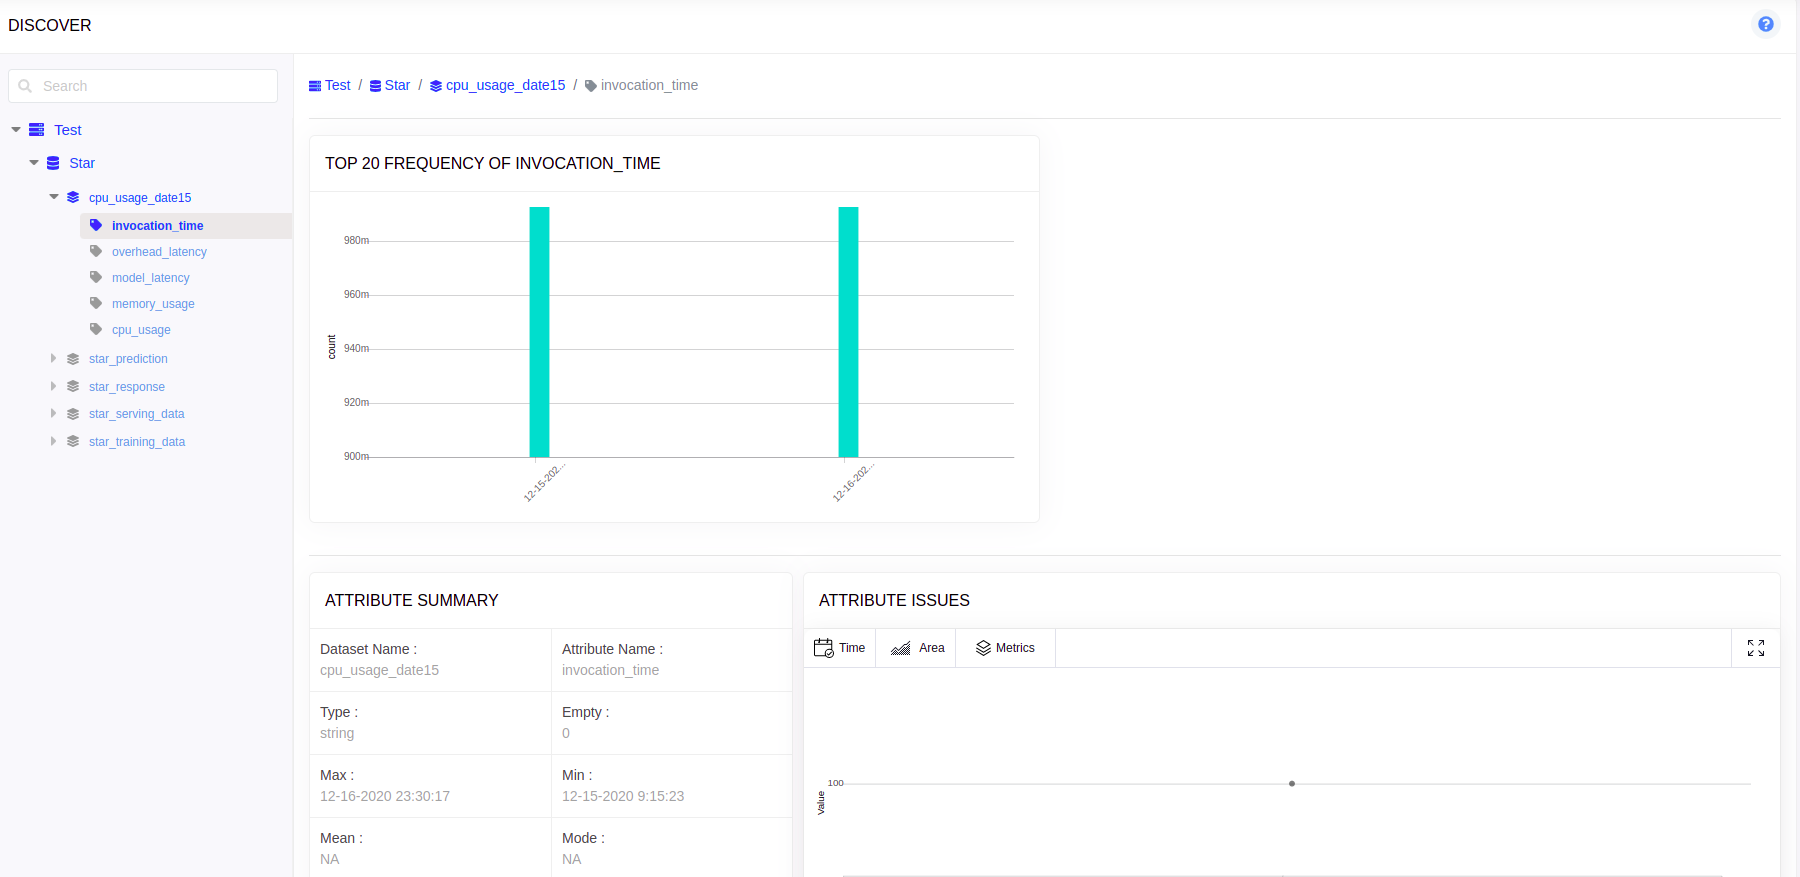
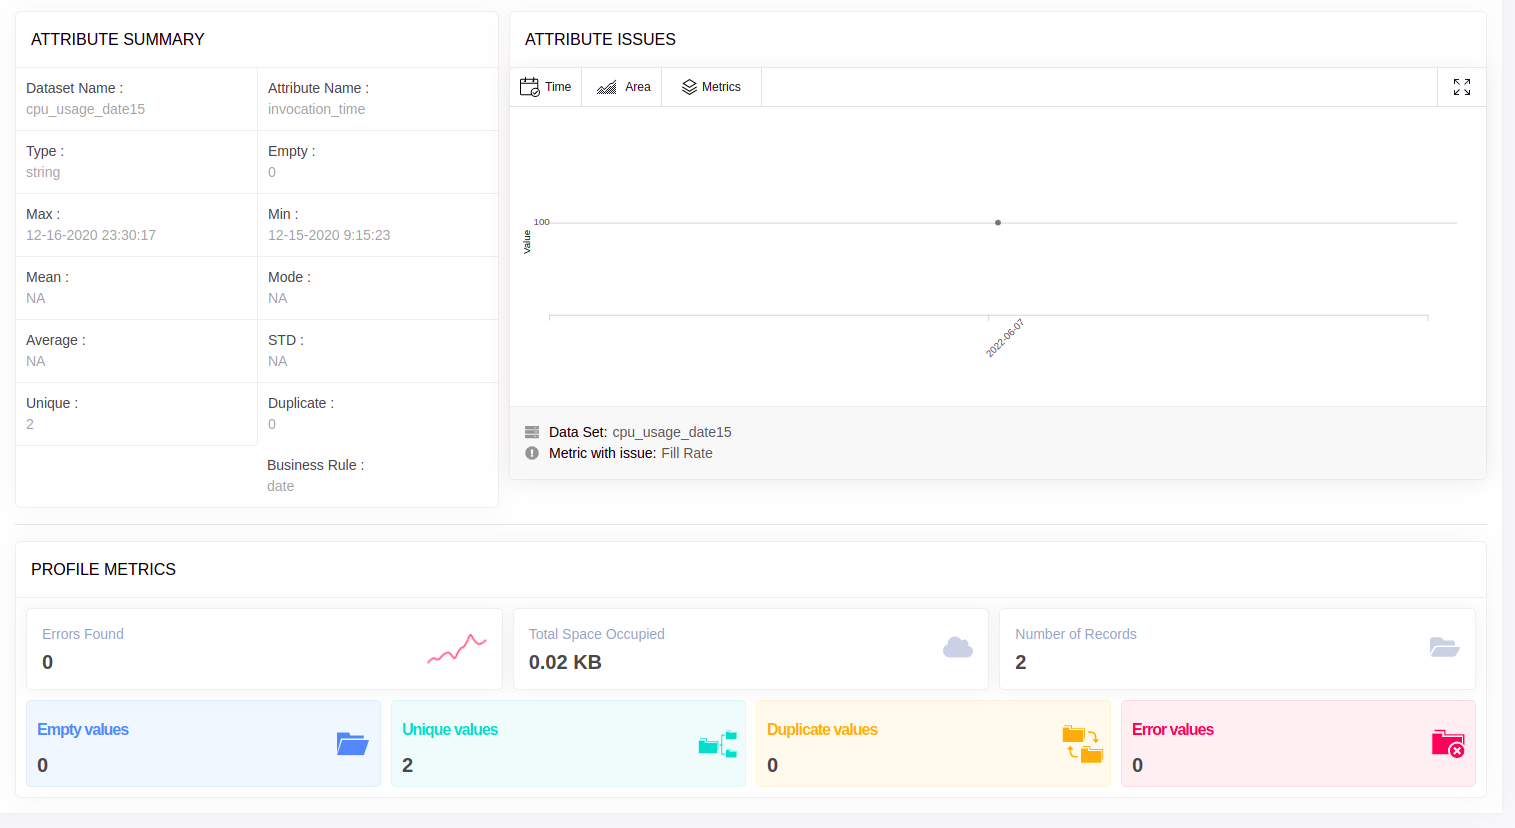
Visualization: Attribute
- Visualization gives a quick peek on the summary of the selected attribute.